Announcement

Collapse
No announcement yet.

Volume Related EFS

Collapse
X
 
  • Filter
  • Time
  • Show
Clear All
new posts

  • Volume Related EFS

    To:
    Brad Matheny, Chris of Divergence Software, Paul of Futuresnets, TSsupport, Alex Montenegro, Dloomis, Fibbgann, Jason K of eSignal, and Matt Gunderson of eSignal:

    I am fairly new but have acquired some grip at least on the structure of efs since the past two weeks. Over the long weekend I browsed thru most of the EFS Studies postings and came up with the names above who may perhaps be able to help in what I am trying to achieve or at least let me know if at all possible currently.

    The Case:
    Volume Histograms: These are basically # of shares traded on each bar or interval, starting from zero at the beginning of the bar. As an eg, if there were 4 trades in the bar and they were 1000 shares per trade, the volume for that bar would be 4000. So essentially what is happening in the bar is trade vol #2 gets added to trade vol #1, #3 to (#1 + #2) and this cumulative adding goes on until the end of the bar.

    Questions:
    1) Instead of the trade volume cumulation, is it possible to just cumulate the #of trades per bar?
    2) In the example given above, what would be the approach to
    plot the cumulative volume of only those trades (out of the four) that passed a certain condition or conditions? As an eg, volumes of trade#1,3 and 4 passed the condition, therefore the cumulative volume of that bar will be 3000 (and not 4000 as trade#2 did not pass the condition and therefore its volume got excluded from being cumulated in the bar).

    Thanks in advance for any help.

    ps, I have tried some approaches like "if getbarstate=currentbar", and "volume(0)" but that road don't look right!
    Fred

  • #2
    Re: Reply to post 'Volume Related EFS'

    I must say you found many of the people who post a lot....

    The Case:

    If I was going to add the number of trades per INTERVAL - and there is a
    slight distinction between interval and bar volume, right? - I would

    function main(){

    if(getBarState()==BARSTATE_NEWBAR){
    counter = 0;
    }
    counter=counter+1;
    debugPrintln(counter);
    return counter;//set it up as a histogram
    }

    if I was going to use a filter (criteria) for the volume I would start
    here..

    function main(){

    if(getBarState()==BARSTATE_NEWBAR){
    counter = 0;
    }
    if(criteria==true)
    counter=counter+1;
    debugPrintln(counter);
    return counter;//set it up as a histogram
    }

    Any questions?

    Comment


    • #3
      Hello dloomis,

      First of all, thanks very much for getting back.

      "add the number of trades per INTERVAL " - yes, that is right.

      I tried your approach for counting the # of trades in each interval and its returning and plotting 1 for every bar. Here is the code:

      function premain(){
      set StudyTitle("TPB");
      setCursorLabelName("TC",0);
      setDefaultBarFgColor(Color.yellow,0);
      setPlotType(PLOTTYPE_HISTOGRAM,0);
      }
      function main(){
      if(getBarState()==BARSTATE_NEWBAR0{
      counter=0;
      }
      counter=counter+1;
      return counter;
      }

      Am I doing something wrong?
      Fred

      Comment


      • #4
        Re: Reply to post 'Volume Related EFS'

        What interval are you using?

        Also, I just saw a typo

        if(getBarState()==BARSTATE_NEWBAR0{

        s/b

        if(getBarState()==BARSTATE_NEWBAR{

        Also, you will see 1 plotted til real time data comes in

        Comment


        • #5
          Hi dloomis,
          Typing error (already!)
          Here is the code again:

          function premain(){
          set StudyTitle("TPB");
          setCursorLabelName("TC",0);
          setDefaultBarFgColor(Color.yellow,0);
          setPlotType(PLOTTYPE_HISTOGRAM,0);
          }
          function main(){
          if(getBarState()==BARSTATE_NEWBAR){
          counter=0;
          }
          counter=counter+1;
          return counter;
          }
          Fred

          Comment


          • #6
            Interval I used are 1, 5, 10, 15, 60....all intraday.
            Ah..so it will work only when I start getting data in real time!

            How would I be able to do this any time, ie., on history bars for back testing, after hours analysis, etc.
            Fred

            Comment


            • #7
              or even when I switch from one symbol to another in the same chart during market hours...for all the bars loaded on the chart?

              I can see there may be a problem when scrolling left and pull in more bars...one way to handle this maybe set limit on the bars loaded, perhaps?
              Fred

              Comment


              • #8
                Re: Reply to post 'Volume Related EFS'

                The efs will not work on old data because the data used to calculated the
                number of trades is not sent every time the chart is reloaded.

                Comment


                • #9
                  Fred

                  How would I be able to do this any time, ie., on history bars for back testing, after hours analysis, etc.

                  You could use Tick Replay.
                  Alex

                  Comment


                  • #10
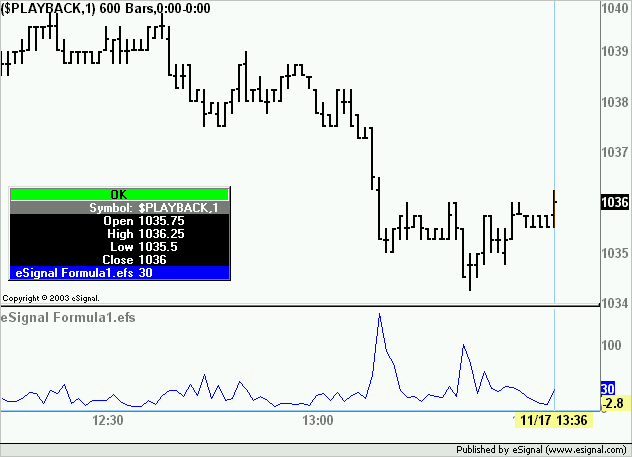
                    if Plottype is histogram, why is this plotting a line...and blue instead of yellow?

                    PHP Code:
                    function premain(){
                        
                    setStudyTitle("Trade Counter");
                        
                    setCursorLabelName("TC",0);
                        
                    setDefaultBarFgColor(Color.yellow,0);
                        
                    setPlotType(PLOTTYPE_HISTOGRAM,0);
                    }
                    function 
                    main(){
                    if(
                    getBarState()==BARSTATE_NEWBAR){
                    counter=0;
                    }
                    counter=counter+1;
                    return 
                    counter;

                    Last edited by michaelm; 12-31-2003, 01:46 PM.
                    Michael

                    Comment


                    • #11
                      Michael
                      Happy New Year.
                      Because preMain() is written incorrectly ie premain()
                      Alex

                      Comment


                      • #12
                        I knew it had to be simple...thanks on both accounts, Alex...and a happy new year to you as well!
                        Michael

                        Comment


                        • #13
                          First of, A Very Happy & Prosperous 2004!

                          Alex, thanks very much for your response.

                          I also wish to thank Chris Kryza and Brad Matheny for responding directly to my email. They are basically of the same opinion - ie, it can be done only when new data comes in.

                          dloomis, you're right, the data we need to calculate on old data is not there when we reload.

                          Now I have an idea that I would like to share:

                          Is it possible to count the # of ticks per the time interval we desire (which can be an input - 1,2,5,10,15min, etc), in a tick chart and plot the output as an indicator (plottype - histogram) in the intraday chart?

                          For eg, if we wish to count the # of ticks per bar in a 5min intraday chart, we could use some logic in the tick chart like:
                          if current bar's time minus previous bar's time is less than or equal to 5 minutes then x = x+1;
                          where x = # of ticks per 5 minutes
                          We then plot "x" as a histogram in the 5min intraday chart. Since we are calculating "x" from the tick chart we should be able to plot "x" for both history and new bars in the 5min intraday chart.

                          If the above is possible, then ideal achievement would be the following:
                          1) we should be able to calculate "x" based on tick data (and not by physically opening a tick chart).
                          2) for new bars coming in (in the intraday chart), "x" should update every tick and not at the end of a bar (just like dloomis' code is updating right now).
                          3) the code should somehow know in what intraday time frame we are charting so that user input is not required to instruct the code to calculate "x" every "so many minutes" off the tick data.
                          4) I guess one other thing that we need to make sure is synchronization of the start and end times of each bar in the intraday chart with the start and end time of the "x" count off the tick data.

                          File that may help is IntervalMA4.efs by JasonK (just search the forum by typing in the file name).

                          If we can achive this, I can see a slew of possibilities opening up!
                          Fred

                          Comment


                          • #14
                            Re: Reply to post 'Volume Related EFS'

                            Fred

                            I see your point, and here are some ideas I had before my first cup of
                            coffee.

                            To get tick data you will have to open a tick chart - no big deal, this can
                            be done in the 'background'. There is a limit of 10 days of back data.

                            As the tick chart is loading, you could watch the timestamps of the ticks as
                            they come in, resetting your counter to 0 when a new bar forms on the higher
                            time period chart. The counter values could be passed back to the higher
                            period chart either as a global variable - or perhaps some other way.

                            This will do a lot of the work on a tick chart - now you need a way to get
                            the higher period chart interval into it and the tick count out.

                            debugClear();
                            var fractionTime;
                            var fractionTimeOld;
                            var tick;

                            function main(){
                            time=getHour()*10000+getMinute()*100+getSecond();//this gets the time
                            stamp
                            interval=5; //get this from the
                            higher period chart
                            fractionTimeOld=fractionTime; //save the old time
                            fractionTime=time%interval; //figure out if there
                            is a new bar

                            if(fractionTimeOld>fractionTime){ //oh, a new bar!
                            debugPrintln("new bar!
                            tick="+tick+"now="+fractionTime+"old="+fractionTim eOld);//tell everyone
                            tick=0; //reset the counter
                            }

                            tick=tick+1; //increment the counter

                            return;

                            }

                            Comment


                            • #15
                              Tick data available in non-tick-charts

                              I do tick by tick analysis *all* the time, and avoid Tick Charts (T), by using the 1s interval or higher, and I analyze each tick for volume/price, etc. Maybe I misunderstood, but you don't need, and probably should avoid, the tick chart for analysis of tick data.

                              Don't setComputeOnClose, and just analyze each tick coming inside the interval, by keeping an outer level variable lastVol representing the last cumulative volume(), and just subtract that from each incoming volume(), (setting lastVol to the last incoming cumulative volume for next time), giving you the volume of that tick. On BARSTATE_NEWBAR, set lastVol to zero prior to calculating this tick's volume.

                              Don't use a tick chart for tick analysis, but if your chart is forced to reload, you will lose all of your intrabar analysis data.

                              Hope this adds something to the discussion.

                              Comment

                              Working...
                              X