Announcement

Collapse
No announcement yet.

10 hi/lo data in 1 minute chart

Collapse
X
 
  • Filter
  • Time
  • Show
Clear All
new posts

  • 10 hi/lo data in 1 minute chart

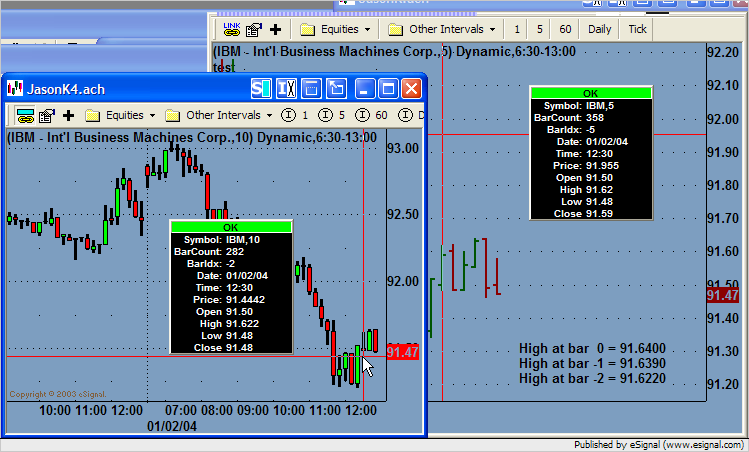
    I am trying to build an EFS study that will show (with coloring) trade triggers in a 1-minute chart. Part of my strategy requires that the LAST be making a hi or lo vs. one of the last three 10-minute bars. How can I get the last three 10-minute hi/lo's when I am in a 1-minute chart.

    Even if the current time is 10:18, I want the 10-min data as it lands on real 10-min boundaries (e. g. 9:40, 9:50, 10:00, not 9:48, 9:58, 10:08). Thx!

  • #2
    Hello axiswest,

    When you are at the current bar (bar index = 0), you can simply pass the symbol and interval to high() or low() etc and you will get the bar data you're looking for. When you pass a symbol and interval to those calls, they use the same index value, so this will only work when you are at the current bar. If you need to have historical high/low data of the 10 min interval accessed when the formula is loading, you'll need to incorporate and mapping routine that finds the corresponding bar index in the 10 min chart. If you don't need the historical stuff then don't worry about it. Just check for the bar index of 0 with getCurrentBarIndex() before you make the calls. The code example below demonstrates this method. Let me know if this helps.

    PHP Code:
    function preMain() {
        
    setPriceStudy(true);
        
    setStudyTitle("test");
        
    setShowCursorLabel(false);
    }


    function 
    main() {
        if (
    getCurrentBarIndex() != 0) return;
        var 
    sym "IBM,10";
        
        var 
    h0 high(0sym);
        var 
    h1 high(-1sym);
        var 
    h2 high(-2sym);
        if (
    h0 == null || h1 == null || h2 == null) return;
        
        
    drawTextAbsolute(245"High at bar  0 = " h0.toFixed(4), Color.blacknull,
            
    Text.RELATIVETOBOTTOM|Text.BOLD|Text.LEFTnull12"0bar");
        
    drawTextAbsolute(230"High at bar -1 = " h1.toFixed(4), Color.blacknull,
            
    Text.RELATIVETOBOTTOM|Text.BOLD|Text.LEFTnull12"1bar");
        
    drawTextAbsolute(215"High at bar -2 = " h2.toFixed(4), Color.blacknull,
            
    Text.RELATIVETOBOTTOM|Text.BOLD|Text.LEFTnull12"2bar");
        
        return;

    Jason K.
    Project Manager
    eSignal - an Interactive Data company

    EFS KnowledgeBase
    JavaScript for EFS Video Series
    EFS Beginner Tutorial Series
    EFS Glossary
    Custom EFS Development Policy

    New User Orientation

    Comment

    Working...
    X