Announcement

Collapse
No announcement yet.

EFS DDE Links

Collapse
This topic is closed.
X
X
 
  • Filter
  • Time
  • Show
Clear All
new posts

  • EFS DDE Links

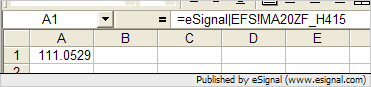
    According to the new features list for 7.5, EFS DDE links to Excel are now possible. Unfortunately, online representatives do not know of anyway to do this.

    I would like to link to a moving average formula for a particular intraday chart in esignal. For example, if I have a 40 period moving average on a 15-minute intraday chart of ESH4, what is the DDE link that I input in an Excel cell to constantly show the update moving average value?

    Help ASAP will be greatly appreciated! Thanks

  • #2
    TBond
    You can find an example of EFS DDE link in this thread.
    Alex

    Comment


    • #3
      OK, so I created the following study (see below) and referenced in Excel as: =eSignal|EFS!MA20

      This only references the last chart to which this formula is applied. I need some type of variable for symbol and time period. I want to be able to show, for example, the 20 period MA for ESH4 on three different time periods and also be able to do the same for SPH4. The only way to dod this without a symbol and time period variable is to make 6 differnet formulas (e.g., DDE MA20ESH4A, DDE MA20ESH4B, DDE MA20ESH4C, DDE MA20SPH4A, DDE MA20SPH4B, DDE MA20SPH4C) where A, B, C are the different intraday time frames. There must be a better way than this brute force method :-)

      Thanks in advance for a prompt reply!

      ===================
      var ddeMA20 = new DDEOutput("MA20");

      function preMain() {
      setPriceStudy(true);
      setStudyTitle("DDE MA20");
      setShowCursorLabel(false);
      }

      function main() {
      var vMA20 = call("/library/ema.efs", 20);

      if(vMA20 != null) ddeMA20.set(vMA20);

      return;
      }

      Comment


      • #4
        Hello TBond,

        You can accomplish what you need with a single formula. You will still have to have the formula running on each chart separately. The key is to create a routine that builds the name for the DDE output based on chart's symbol and interval. For example, if you run the code on IBM daily chart, your reference in Excel would be =eSignal|EFS!MA20IBMD. Run the same formula on IBM 5 min chart the Excel reference would be =eSignal|EFS!MA20IBM5. Try the code below and let me know if this helps.

        PHP Code:
        var ddeMA20 null;

        function 
        preMain() {
            
        setPriceStudy(true);
            
        setStudyTitle("DDE MA20");
            
        setShowCursorLabel(false);
        }

        function 
        main() {
            if (
        ddeMA20 == null) {
                var 
        sName "MA20" getSymbol() + getInterval();
                
        ddeMA20 = new DDEOutput(sName);
            }

            var 
        vMA20 call("/library/ema.efs"20);
            if(
        vMA20 != nullddeMA20.set(vMA20);

            return;

        Jason K.
        Project Manager
        eSignal - an Interactive Data company

        EFS KnowledgeBase
        JavaScript for EFS Video Series
        EFS Beginner Tutorial Series
        EFS Glossary
        Custom EFS Development Policy

        New User Orientation

        Comment


        • #5
          That does not seem to work. I tried on chart named FVH4-15 (FVH4 for symbol FV H4 and the 15 is 15 min interval) - see formula below. When I input =eSignal|EFS!MA20FVH4-15' I get the Excel error "#NAME?"


          ==========
          var ddeMA20 = null;

          function preMain() {
          setPriceStudy(true);
          setStudyTitle("DDE MA20");
          setShowCursorLabel(false);
          }

          function main() {
          if (ddeMA20 == null) {
          var sName = "MA20" + getSymbol() + getInterval();
          ddeMA20 = new DDEOutput(sName);
          }

          var vMA20 = call("/library/ema.efs", 20);
          if(vMA20 != null) ddeMA20.set(vMA20);

          return;

          Comment


          • #6
            Hello TBond,

            I see the problem. We can't use spaces in the name. Add the following line of code right after var sName = ....

            PHP Code:
                    sName sName.replace(" ""_"); 
            This will replace all spaces with and underscore. Your Excel reference will now be =eSignal|EFS!MA20FV_H415.
            Jason K.
            Project Manager
            eSignal - an Interactive Data company

            EFS KnowledgeBase
            JavaScript for EFS Video Series
            EFS Beginner Tutorial Series
            EFS Glossary
            Custom EFS Development Policy

            New User Orientation

            Comment


            • #7
              There is no "space" in the chart name just the symbol name. The chart name is "FVH4-15". How do I change the format to handle this? Thanks for the prompt assistance!

              Comment


              • #8
                Hello TBond,

                The name used for the DDE formula in Excel doesn't come from your chart's name, it comes from the string, sName, in the formula. This string, or name, is built when the formula is first applied to a chart, which is a combination of the string, "MA20" plus the chart's current symbol and interval. If you apply this formula to any of your charts using the symbol ,FV H4, the string will become: MA20 + getSymbol() + getInterval(). So, a chart is using FV H4 on a 15 minute interval for example, the name will be set to MA20FV_H415. This is the name you'll need to use in Excel (i.e. =eSignal|EFS!MA20FV_H415). Let me know if this clears up the confusion.

                PHP Code:
                var ddeMA20 null;

                function 
                preMain() {
                    
                setPriceStudy(true);
                    
                setStudyTitle("DDE MA20");
                    
                setShowCursorLabel(false);
                }

                function 
                main() {
                    if (
                ddeMA20 == null) {
                        var 
                sName "MA20" getSymbol() + getInterval();
                        
                sName sName.replace(" ""_");
                        
                ddeMA20 = new DDEOutput(sName);
                    }

                    var 
                vMA20 call("/library/ema.efs"20);
                    if(
                vMA20 != nullddeMA20.set(vMA20);

                    return;

                Jason K.
                Project Manager
                eSignal - an Interactive Data company

                EFS KnowledgeBase
                JavaScript for EFS Video Series
                EFS Beginner Tutorial Series
                EFS Glossary
                Custom EFS Development Policy

                New User Orientation

                Comment


                • #9
                  The changes seem to work fine on various time periods for symbol FV H4. However, I tried attaching the same formula to a chart of ZF H4 and I get the #NAME? error in Excel when I use

                  =eSignal|EFS!MA20ZF_H4XX, where XX is the time period

                  Comment


                  • #10
                    Hello TBond,

                    What interval are you using? I just tested the formula on ZF H4 15 minute chart and its working on my end. You might need to force the spreadsheet to update. In Excel, press F9 or select the cell with the formula, press F2 and then ENTER. See if that fixes it.

                    Jason K.
                    Project Manager
                    eSignal - an Interactive Data company

                    EFS KnowledgeBase
                    JavaScript for EFS Video Series
                    EFS Beginner Tutorial Series
                    EFS Glossary
                    Custom EFS Development Policy

                    New User Orientation

                    Comment


                    • #11
                      Jason,

                      I had already tried the F2 and F9 options and also double checked for typos. I checked the charts - for some reason my ZF charts only showed about half of yesterday's data and now prior. I shutdown and reloaded this AM and all the data is there and the formulas are working correctly. Thanks for the assistance!

                      I'm also trying to write a few other studies - the one below the current one I'm working on. Here is what I would like to accomplish (what I have so far only works using intraday bars - i.e., the prior 4 H-O etc is the prior 4 intraday bars)

                      I would like a study and alert that triggers on the following conditions:

                      1. is updated intraday on anytime timeframe chosen if today is day "0"
                      2. upside alert: today's high is greater than or equal to today's open plus the average of the prior four days' intraday highs - open e.g. today's high >= today's open plus average of ((High-Open)day"-1"+(High-Open)day"-2"+(High-Open)day"-3"+(High-Open)day"-4"
                      3. downside alert: today's low is less than or equal to today's open plus the average of the prior four days' intraday lows - open e.g. today's low <= today's open plus average of ((Low-Open)day"-1"+(Low-Open)day"-2"+(Low-Open)day"-3"+(Low-Open)day"-4"

                      On an intraday basis I want the calculation done using DAILY highs - opens and lows -opens for prior days and then add or subtract that to today's open. Therefore for instance on bonds if the calculations for the daily h-o and l-o for prior days is +7/32 and -7/32 then today for the entire day the upside alert would be equal to the open for the day at 0820 ET +7/32 or -7/32. only when those prices levels are broken on an intraday is the alert generated.

                      =======
                      function preMain() {
                      setPriceStudy(true);
                      setStudyTitle("Strategy");
                      }

                      function main() {
                      var avgh = 0, avgl = 0;
                      var vHL = high() - low();
                      var vVar = vHL * 0.25;
                      var vaddvar = vVar * 0.35;

                      for(i = -4; i < 0; i++){
                      avgh += high(i) - open(i);
                      avgl += low(i) - open(i);
                      }

                      avgh /= 4;
                      avgl /= 4;

                      if(high() >= open() + avgh){
                      Alert.playsound("Alert.wav");
                      Alert.addtolist(getsymbol(), "upside alert", Color.black, Color.green);

                      }
                      if(low() <= open() + avgl){
                      Alert.playSound("Alert.wav");
                      Alert.addToList(getSymbol(), "downside alert", Color.black, Color.green);

                      }


                      }

                      Comment


                      • #12
                        Hello gem2004,

                        Because \Library\macd.efs returns an array, you just need to do a .set() for each array item separately.

                        Try the formula below, which is a better way to go in my opinion. Let me know if you have any questions.

                        PHP Code:
                        var ddeMACD null;
                        var 
                        ddeMACDsig null;
                        var 
                        vMACD null;

                        function 
                        preMain() {
                            
                        setPriceStudy(true);
                            
                        setStudyTitle("DDE MACD");
                            
                        setShowCursorLabel(false);
                        }

                        function 
                        main() {
                            if (
                        ddeMACD == null) {
                                var 
                        sName "MACD" getSymbol() + getInterval();
                                
                        sName sName.replace(" ""_");
                                
                        //debugPrintln(sName);
                                
                        ddeMACD = new DDEOutput(sName);
                                
                        sName "MACDsig" getSymbol() + getInterval();
                                
                        sName sName.replace(" ""_");
                                
                        //debugPrintln(sName);
                                
                        ddeMACDsig = new DDEOutput(sName);
                            }

                            if (
                        vMACD == nullvMACD = new MACDStudy(12269"Close"true);

                            var 
                        MACD vMACD.getValue(MACDStudy.MACD);
                            var 
                        MACDsig vMACD.getValue(MACDStudy.SIGNAL);
                            if (
                        MACD == null || MACDsig == null) return;
                            
                            if(
                        vMACD != null) {
                                
                        ddeMACD.set(MACD.toFixed(4));
                                
                        ddeMACDsig.set(MACDsig.toFixed(4));
                            }

                            return;

                        Jason K.
                        Project Manager
                        eSignal - an Interactive Data company

                        EFS KnowledgeBase
                        JavaScript for EFS Video Series
                        EFS Beginner Tutorial Series
                        EFS Glossary
                        Custom EFS Development Policy

                        New User Orientation

                        Comment

                        Working...
                        X