Announcement

Collapse
No announcement yet.

Volume EMA 50 day

Collapse
X
 
  • Filter
  • Time
  • Show
Clear All
new posts

  • Volume EMA 50 day

    Does anyone no where I can find this.

    Volume 50 day EMA like the one used in quotetracker


    Thanks,
    Brian
    Last edited by Co|dStee|; 01-15-2004, 11:45 AM.

  • #2
    Brian
    The attached efs plots the volume and a 50 period EMA of Volume.
    It was created using only the Formula Wizard which needs to be used to change the parameters.
    Alex
    Attached Files

    Comment


    • #3
      Is there a way to change line thicknes and color


      Thanks,
      Brian

      Comment


      • #4
        Alexis,

        Is there anyway to get it to work like the original with colored bars and thicker lines.


        Thanks,
        Brian

        Comment


        • #5
          Brian
          Open the efs using the Formula Wizard and you can change all you want
          Alex

          Comment


          • #6
            Brian
            The attached revision of the efs adds the conditions to color the volume bars depending on whether the volume is higher/lower than the prior one.
            Open the efs with the Formula Wizard to change colors, thickness, conditions, etc.
            Alex
            Attached Files

            Comment


            • #7
              Alexis,

              Can you please make it so that the bars change color on a buy/sell condition just like the one thats builtin to eSignal.

              I would do it myself but I dont no yet how to work with EFS files.


              Thank you,
              Brian

              Comment


              • #8
                Brian
                The color of the volume bars in eSignal is not based on buy/sell signals but either on volume being higher/lower than the prior or close being higher/lower than the prior. The attached version now uses the close.
                I would suggest that you at least open the script using the Formula Wizard so as to get acquainted with efs.
                Alex
                Attached Files

                Comment


                • #9
                  Ok thanks I will play around with the formula wizrd to try and get a feel for EFS.

                  Thank you very much,
                  Brian

                  Comment


                  • #10
                    Hello Alexis,

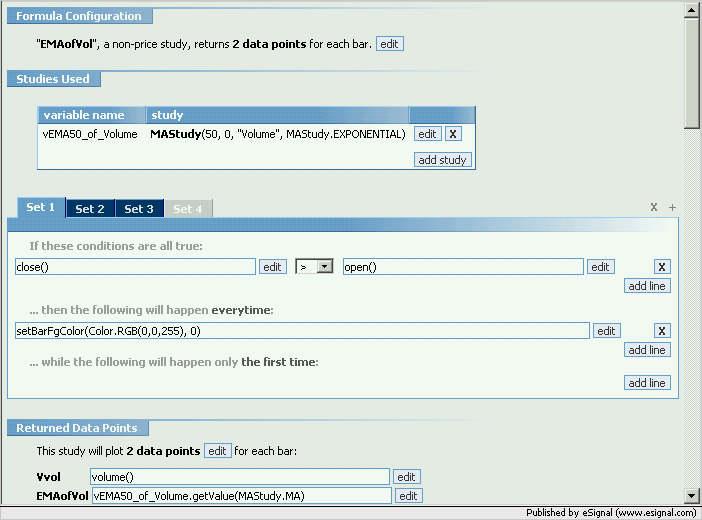
                    Sorry for bothering you agian. I'am trying to find out how to get your emaofvolume script to color the volume bars blue if the close is higher then open and red if the close is lower then open. So it should function like a candlestick. I believe this is how the default volume study is setup in Esignal.


                    Thanks you very much,
                    Brian

                    Comment


                    • #11
                      Brian
                      If you prefer to have it based on Close being higher/lower than Open then open the efs with the Formula Wizard and change the conditions in Set1 and Set2 (in the image below Set1 is shown as an example)
                      Alex

                      Comment


                      • #12
                        Alexis

                        Sorry for wasting your time I feel stupid I though it would be much harder to set up.


                        I swear I have to learn this stuff

                        Comment


                        • #13
                          Brian
                          That was no bother at all.
                          Yes I would suggest looking at the features of the Formula Wizard because, despite some limitations, it is a great tool to whip together an efs in no time. Add to that the fact that it really does not require much beyond a very basic understanding of efs.
                          Glad to have helped
                          Alex

                          Comment

                          Working...
                          X