 Tweet
Tweet
Hi,
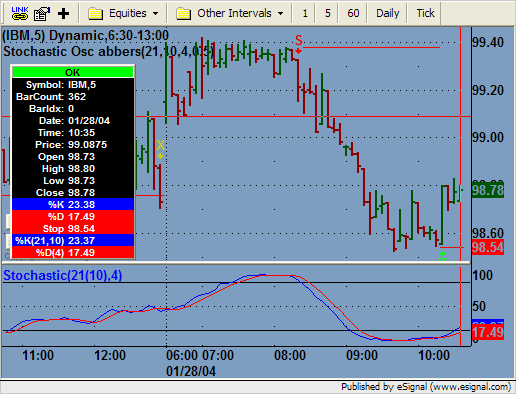
The following EFS is very close to what i need but needs a few amendments which i hope someone can help me with.
I am looking to keep the buy/sell signals with stop line when the %k line crosses thru the 80 and 20 overbought / oversold ievels,
but remove the price bar colors.
It also does not plot the signals of a normal stochastic 21,10,4 study...maybe because its calculating something else also, could not work out what exactly.
Many thanks
Here is the study:
/************************************************** ***************
Provided By : eSignal. (c) Copyright 2003
************************************************** ***************/
function preMain() {
setPriceStudy(true);
setStudyTitle("Stochastic Osc ");
setCursorLabelName("\%K", 0);
setCursorLabelName("\%D", 1);
setCursorLabelName("Stop", 2);
setDefaultBarFgColor(Color.blue, 0);
setDefaultBarFgColor(Color.red, 1);
setDefaultBarFgColor(Color.purple, 2);
setPlotType(PLOTTYPE_FLATLINES, 2);
setColorPriceBars(true);
setDefaultPriceBarColor(Color.white);
var fp1 = new FunctionParameter("nKlength", FunctionParameter.NUMBER);
fp1.setName("\%K Length");
fp1.setLowerLimit(1);
fp1.setDefault(21);
var fp2 = new FunctionParameter("nSmoothing", FunctionParameter.NUMBER);
fp2.setName("\%K Smoothing");
fp2.setLowerLimit(1);
fp2.setDefault(10);
var fp3 = new FunctionParameter("nDlength", FunctionParameter.NUMBER);
fp3.setName("\%D Length");
fp3.setLowerLimit(1);
fp3.setDefault(4);
// Adjusts stop price by the specified increment when clicking the
// adjustment buttons "Stop Up" and "Stop Down."
var fp4 = new FunctionParameter("nStopInc", FunctionParameter.NUMBER);
fp4.setName("Stop Price Increment");
fp4.setLowerLimit(0);
fp4.setDefault(0.5);
}
var bEdit = true;
var study = null;
var vPosition = null;
var vLong = false;
var vShort = false;
var nLBarCntr = 0;
var nSBarCntr = 0;
var vStop = null;
var nSpace = null;
var bEntry = false;
var vColor = Color.white;
var vStopInc = null;
function main(nKlength, nSmoothing, nDlength, nStopInc) {
var nState = getBarState();
var l = low();
var l1 = low(-1);
var l2 = low(-2);
var l3 = low(-3);
var l4 = low(-4);
var h = high();
var h1 = high(-1);
var h2 = high(-2);
var h3 = high(-3);
var h4 = high(-4);
var l_min = Math.min(l1, l2, l3).toFixed(2)*1;
var h_max = Math.max(h1, h2, h3).toFixed(2)*1;
if (study == null) {
study = new StochStudy(nKlength, nSmoothing, nDlength);
nSpace = (.2 * (high()-low()));
drawTextAbsolute(5, 35, " Stop Up @URL=EFS:stopUp", null, null,
Text.BUTTON|Text.CENTER|Text.BOLD|Text.RELATIVETOL EFT|Text.RELATIVETOBOTTOM,
null, 10, "stopUp");
drawTextAbsolute(5, 15, "Stop Down@URL=EFS:stopDown", null, null,
Text.BUTTON|Text.CENTER|Text.BOLD|Text.RELATIVETOL EFT|Text.RELATIVETOBOTTOM,
null, 10, "stopDown");
}
var vK = study.getValue(StochStudy.FAST, -1);
var vD = study.getValue(StochStudy.SLOW, -1);
if (vK == null || vD == null) return;
if (bEdit == true) {
if (nStopInc != null) vStopInc = nStopInc;
}
if (nState == BARSTATE_NEWBAR) {
bEntry = false;
if (vLong == true) nLBarCntr += 1;
if (vShort == true) nSBarCntr += 1;
if (vPosition == null) {
vStop = null;
vColor = Color.darkgrey;
}
}
// Entry triggers
if (vPosition != "long" && vLong == false && vK < 20) {
vLong = true;
nLBarCntr = 0;
}
if (vPosition != "short" && vShort == false && vK > 80) {
vShort = true;
nSBarCntr = 0;
}
if (vPosition != "long" && vLong == true && nLBarCntr >= 3) { //Long
var doLong = true;
if (l3 > l4) {
doLong = false;
}
if (l2 > l3 && h2 > h3 ) {
doLong = false;
}
if (l1 > l2 && h1 > h2 ) {
doLong = false;
}
if (h <= h4) doLong = false;
if (doLong == true) goLong(l_min)
}
if (vPosition != "short" && vShort == true && nSBarCntr >= 3) { //Short
var doShort = true;
if (h3 < h4) {
doLong = false;
}
if (h2 < h3 && l2 < l3 ) {
doLong = false;
}
if (h1 < h2 && l1 < l2 ) {
doLong = false;
}
if (l >= l4) doShort = false;
if (doShort == true) goShort(h_max);
}
// Stops
if (bEntry == false) {
if (vPosition == "long" && l < vStop) { // Long Stop
exitLong();
}
if (vPosition == "short" && h > vStop) { // Short Stop
exitShort();
}
}
setPriceBarColor(vColor);
return new Array(study.getValue(StochStudy.FAST).toFixed(2),
study.getValue(StochStudy.SLOW).toFixed(2),
vStop);
}
/******************
**** Functions ****
*******************/
function goLong(nStop) {
bEntry = true;
vPosition = "long";
vColor = Color.green;
vStop = nStop;
vLong = false;
vShort = false;
drawShapeRelative(0, low() - nSpace, Shape.UPARROW, null,
Color.lime, Shape.BOTTOM, "l"+getValue("rawtime"));
drawTextRelative(0, low() - (1.2*nSpace), "B", Color.lime, null,
Text.BOLD|Text.CENTER|Text.TOP|Text.ONTOP, null, 12, "l"+getValue("rawtime"));
return;
}
function goShort(nStop) {
bEntry = true;
vPosition = "short";
vColor = Color.maroon;
vStop = nStop;
vLong = false;
vShort = false;
drawShapeRelative(0, high() + nSpace, Shape.DOWNARROW, null,
Color.red, Shape.TOP, "s"+getValue("rawtime"));
drawTextRelative(0, high() + (1.2*nSpace), "S", Color.red, null,
Text.BOLD|Text.CENTER|Text.BOTTOM|Text.ONTOP, null, 12, "s"+getValue("rawtime"));
return;
}
function exitLong() {
vPosition = null;
drawShapeRelative(0, high() + nSpace, Shape.DOWNARROW, null,
Color.khaki, Shape.TOP, "le"+getValue("rawtime"));
drawTextRelative(0, high() + (1.2*nSpace), "X", Color.khaki, null,
Text.BOLD|Text.CENTER|Text.BOTTOM|Text.ONTOP, null, 12, "le"+getValue("rawtime"));
return;
}
function exitShort() {
vPosition = null;
drawShapeRelative(0, low() - nSpace, Shape.UPARROW, null,
Color.khaki, Shape.BOTTOM, "se"+getValue("rawtime"));
drawTextRelative(0, low() - (1.2*nSpace), "X", Color.khaki, null,
Text.BOLD|Text.CENTER|Text.TOP|Text.ONTOP, null, 12, "se"+getValue("rawtime"));
return;
}
function stopUp() {
if (vStopInc > 0 && getCurrentBarIndex() == 0 && vStop != null) {
vStop += vStopInc;
}
}
function stopDown() {
if (vStopInc > 0 && getCurrentBarIndex() == 0 && vStop != null) {
vStop -= vStopInc;
}
}
Comment