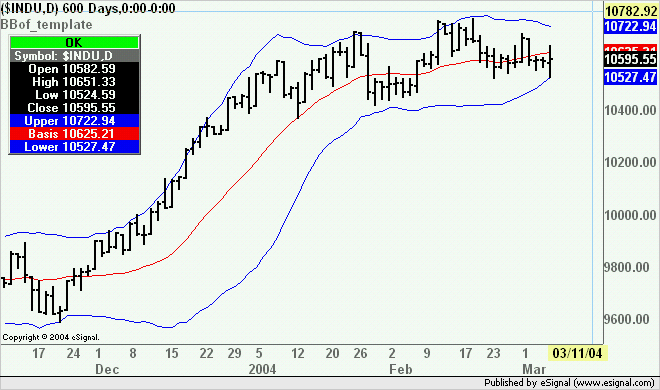
Hi, I want to make a study that will show the $TICK value along with Bollinger Bands around it. I thought I could do this by editing the Bollinger Bands of RSI study to be a Bollinger Bands of $TICK study. However, it does not seem to work out this way.
Here is what I have, it returns the tick value alright, but nothing is happening with the Bollinger Bands.
var tickbb = null;
var tick = null;
function main() {
tick = close("$TICK,5");
if(tickbb == null) tickbb = new BollingerStudy(20, tick, 2.0);
.
.
.
.
Anyway, this is not working, any help would be appreciated.

Comment