Announcement

Collapse
No announcement yet.

Delivery of bid/ask info without a new tic?

Collapse
This topic is closed.
X
X
 
  • Filter
  • Time
  • Show
Clear All
new posts

  • Delivery of bid/ask info without a new tic?

    OK, I'm really confused about delivery of bid/ask information using getMostRecentBid/Ask functions, and whether you need to have a new tic in order to enter the EFS instance.

    Typically I use an interval chart such as 10s or 1 minute. I stay away from tick charts because of some graphical limitations.

    But, I would like to get bid/ask updates and I think I need a tic in order for my formula to be called, right? This is at least true on an interval chart, from my experience.

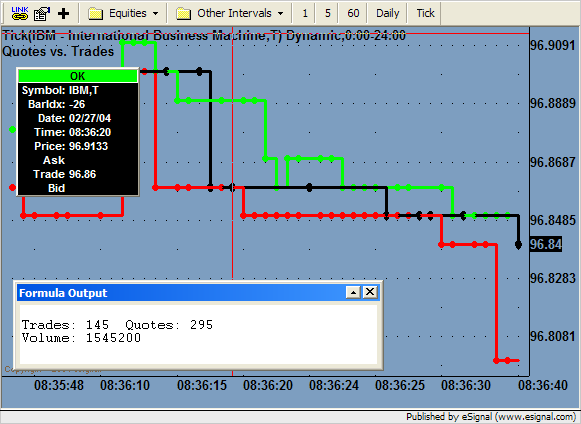
    But it seems that if I change the chart to "T", that I am informed of every bid/ask change, even though the most recent tic price value is delivered repeatedly as the close() price.

    So, I'm confused. If I use an interval chart, I can't seem to get bid/ask updates without a tic. But if I use a "T" chart, then I can't distinguish between bid/ask updates and new tics. Is there any condition of getBarState() which distinguishes between bid/ask updates only, and new tics or trades?

    Is there any way I can get bid/ask updates in my interval charts without a tic?

    Can someone explain this to me?

  • #2
    For any chart interval other than Tick (isTick() in an efs - shows T without a number in the chart) you get Ask and Bid only when there is a trade. On a Tick chart you will get the Bid and Ask together whenever either changes. Take a look at a Tick download in a text editor. Hope this helps.

    I'm pretty sure that this is accurate. If someone has other information, please correct me.

    Comment


    • #3
      code snippet and barstate in Tick chart

      OK, this code snippet delivers (apparently randomly), newbar and currentbar states, while there is only a bid/ask change, and NO trades. I ran it on 6E #F (Euro on Globex/CME) after hours when things were really quiet.

      This confuses me even more, because I thought I might be able to use the currentbar state to detect intra-tic bid/ask changes, but I guess not... Shouldn't there be a bar state corresponding to "no it's not a new trade, but there's new bid/ask info" ?


      /* test code to run in a Tick chart printiing bar states, tick-bid-ask */

      var bid=null;
      var ask=null;
      var tick=null;
      var count=0;

      function preMain() {
      setStudyTitle("Bid-Ask");
      setCursorLabelName("tick",0);
      setCursorLabelName("bid",1);
      setCursorLabelName("ask",2);
      setDefaultBarFgColor(Color.black,0);
      setDefaultBarFgColor(Color.red,1);
      setDefaultBarFgColor(Color.green,2);
      }

      function main() {
      if (getCurrentBarIndex()<-10) return;
      var state=getBarState();
      if (state==BARSTATE_NEWBAR) {
      debugPrintln("newbar");
      }
      else
      if (state==BARSTATE_CURRENTBAR) {
      debugPrintln("currentbar");
      }
      else
      if (state==BARSTATE_ALLBARS) {
      debugPrintln("allbars");
      }
      else {
      debugPrintln("UNKNOWN:"+state);
      }
      bid=getMostRecentBid();
      ask=getMostRecentAsk();
      tick=close();
      debugPrintln(count++ + ": Bid: "+bid+" Ask:"+ask+" Tick:"+tick);
      return new Array(tick,bid,ask);
      }

      Comment


      • #4
        Try substituting getMostRecentTrade() for close(). You may also want to look at getMostRecentAskSize(), getMostRecentBidSize(), and getMostRecentTradeSize().

        Maybe this excerpt from an ES Tick download will help. When the interval is T, this is what you get. On other intervals the Q (quote) only comes with the T (trade) data. They are not seperate.

        Q,040218,112455,1154.25,1154.5,229,159, ,
        Q,040218,112455,1154.25,1154.5,229,149, ,
        Q,040218,112455,1154.25,1154.5,229,139, ,
        T,040218,112455,1154.5,1,
        Q,040218,112455,1154.25,1154.5,228,138, ,
        T,040218,112455,1154.5,1,
        Q,040218,112455,1154.25,1154.5,227,137, ,
        T,040218,112455,1154.5,2,
        Q,040218,112455,1154.25,1154.5,227,135, ,
        Q,040218,112455,1154.25,1154.5,227,535, ,
        T,040218,112455,1154.5,2,
        Q,040218,112455,1154.25,1154.5,227,533, ,

        Comment


        • #5
          So based on that, the best interval to select is the T interval? Based on what u have shown, I am assuming that that this interval provides the most useful information?

          BTW, excellent information, I had not thought about looking at a tick download file, that takes alot of the mystery out of it, at least for me. Thanks!

          Regards,

          Comment


          • #6
            Still a little confused. When you do a tick download, you don't specify an interval. I assume this is what you meant; a tick download versus a bar download (which I've personally never done)?? Is that what you meant, Gavishti?

            Thanks for the info on the additional built-ins, like getMostRecentTrade(), etc. I really had no idea they were available. Duh...

            I'm sure I'll still have some questions, but let me try the suggestions already made...

            Comment


            • #7
              Is there *any* way to distinguish reliably between a new tick, and an old tick with bid/ask change on a T chart? Meanwhile I'm gonna try and find a way, like, maybe trying getValue("rawtime") or anything I can use to distinguish them...
              TIA

              Comment


              • #8
                Since trying to answer your question I've been looking at live Tick data. Things are a bit different. At this point I'm trying to figure out how to formulate the questions to eSignal staff. I'll post here when I figure out the questions. The zeros are a bit confusing, but there is more going on. For now, here is a sample of the data. The first column is bar state, then minute, second, trade price, trade size, bid price, ask price, bid size x ask size.

                1 35:35 10584 4 10584 10585 18 x 18
                1 35:35 10584 4 10584 10585 17 x 17
                0 35:36 10584 4 10584 10585 17 x 17
                1 35:36 10584 4 10584 10585 19 x 19
                1 35:36 10584 4 10584 10585 19 x 19
                1 35:36 10584 2 10584 10585 19 x 19
                1 35:36 10584 2 10584 10585 21 x 21
                1 35:36 10584 2 10584 10585 21 x 21
                1 35:36 10584 2 0 10585 21 x 21
                1 35:36 10584 2 0 10585 21 x 21
                1 35:36 10584 1 0 10585 0 x 0
                1 35:36 10584 1 0 10585 0 x 0
                1 35:36 10584 1 0 10585 0 x 0
                1 35:36 10584 1 10583 10585 21 x 21
                1 35:36 10584 1 10584 10585 21 x 21
                1 35:36 10584 1 10584 10585 21 x 21
                1 35:36 10584 1 10584 10585 19 x 19
                0 35:37 10584 1 10584 10585 19 x 19
                1 35:37 10584 1 0 10585 19 x 19
                1 35:37 10584 1 10583 10584 3 x 3
                1 35:37 10584 1 10583 10584 4 x 4
                1 35:37 10584 1 10583 10584 4 x 4
                1 35:37 10584 1 10583 10584 4 x 4

                Comment


                • #9
                  Okay, I give. I've been studying a feed from a tick chart (T) and comparing to a Time&Sales. Every time I think I have it figured out I find an exception. It looks like the zeros have something to do with trades. But it looks like there may be more to it.

                  How does one tell the difference between a trade and a quote? For that matter, a Bid and an Ask. I get the distinct feeling I am missing a data element (or more) and the instruction manual.

                  Someone please provide an explanation.

                  Thanks.
                  Last edited by Gavishti; 02-25-2004, 02:24 PM.

                  Comment


                  • #10
                    A Snapshot of the Time & Sales
                    Attached Files

                    Comment


                    • #11
                      A snapshot of the data
                      Attached Files

                      Comment


                      • #12
                        I haven't figured out how to distinguish a new tic from a quote update. getValue("rawtime") doesn't do it. But I also tried drawTextRelative, and it "creeps" across the T chart, so I can't even mark volumes on a price, given that I get a price and/or volume change, which would indirectly indicate a new tic.

                        We need a getBarState() flag to distinguish the two, and some work on alignment of graphics on the T chart, which I thought had been addressed...

                        Comment


                        • #13
                          Hello bfry,

                          We don't currently have any built-in functions or methods within EFS to make the determination between a quote and a trade. Please submit a suggestion to [email protected] and ask for the update type (quote vs. trade) to be exposed to EFS.

                          getBarState() wasn't intended for T charts. The T chart doesn't really have bars. The getMostRecent functions only work in real time. So if you try to use them in tick replay, I don't think you're going to get the results you expect.

                          I have an idea for you to test on a T chart with some real time data tomorrow. Here's the logic. We know that trades have size associated with them that increase the cumulative volume figure for the day. Quotes don't. So if we do a comparison of the last cumulative volume figure with the current cumulative volume figure we should be able to tell which chart updates were trades vs. quotes. Here's the basic code example. I haven't tested it so we may need to make some adjustments tomorrow. Keep in mind however, that we still have the issue of the indicator drift bug associated with the T chart. So if we try to return data or draw stuff on the chart, they will drift off the x-axis scale. So the code below just prints some totals to the formula output window.

                          PHP Code:
                          // Set chart to a "T" interval.

                          function preMain() {
                              
                          setPriceStudy(true);
                              
                          setStudyTitle("Quotes vs. Trades");
                              
                          setShowCursorLabel(false);
                              
                          }

                          var 
                          vLast null;
                          var 
                          vCurrent null;
                          var 
                          Quotes 0;
                          var 
                          Trades 0;

                          function 
                          main() {
                              
                          debugClear();
                              
                              if (
                          getDay(0) != getDay(-1)) {
                                  
                          vCurrent 0;
                                  
                          Quotes 0;
                                  
                          Trades 0;
                              }
                              
                              
                          vLast vCurrent;
                              
                          vCurrent += volume();
                              if (
                          vLast == null) return;
                              
                              if (
                          vCurrent == vLast) {
                                  
                          // This was a Quote
                                  
                          Quotes++
                              } else if (
                          vCurrent vLast) {
                                  
                          // This was a Trade
                                  
                          Trades++
                              }
                              
                              
                          debugPrintln("Trades: " Trades "  Quotes: " Quotes);
                              return;

                          Jason K.
                          Project Manager
                          eSignal - an Interactive Data company

                          EFS KnowledgeBase
                          JavaScript for EFS Video Series
                          EFS Beginner Tutorial Series
                          EFS Glossary
                          Custom EFS Development Policy

                          New User Orientation

                          Comment


                          • #14
                            howz about calling a DLL ??

                            Jason, I tried this and it doesn't appear to work. The function volume() is not cumulative in T charts.

                            The closest I think we can come to recognizing trades is if either volume() or close() changes from a preceding invocation, then it's certainly a new trade. But that misses any both equi-volume and equi-price trades. It does, however, allow you to determine whether there's an uptick or a downtick, so that's something.

                            Graphing any result is a "challenge", to put it mildly... However, I've decided I'll probably allow the T chart to publish as much info as it can about Bid/Ask to a global variable, and have an interval chart like 1S, pick up and use that info.

                            BUT... consider this, since EFS can call a DLL. Anybody from Divergence who knows DLL's care to tell us??? <speculation>

                            As a last-gasp effort, I think it may be possible to call one of your DLL's to get the info. Which one should I call, to tell me what we need to know? </speculation>

                            I submitted the suggestion, and appreciate your help.

                            Comment


                            • #15
                              Hello bfry,

                              Well, I thought we might need to make some adjustments. So here it is. The modification below seems to be working now. I also added a check for a bar index of 0 just to speed up the loading process a bit. If you want to collect the historical data for the current day, just take out that first line of code in main.

                              Tchart_QuoteVsTrade.efs

                              PHP Code:
                              function preMain() {
                                  
                              setPriceStudy(true);
                                  
                              setStudyTitle("Quotes vs. Trades");
                                  
                              setShowCursorLabel(false);
                                  
                              }

                              var 
                              vLast null;
                              var 
                              vCurrent null;
                              var 
                              Quotes 0;
                              var 
                              Trades 0;

                              function 
                              main() {
                                  if (
                              getCurrentBarIndex() != 0) return;
                                  
                                  
                              debugClear();
                                  
                                  if (
                              getDay(0) != getDay(-1)) {
                                      
                              vCurrent 0;
                                      
                              Quotes 0;
                                      
                              Trades 0;
                                  }
                                  
                                  
                              vLast vCurrent;
                                  
                              vCurrent += (volume(01, (getSymbol() + ",D")) - vLast);
                                  if (
                              vLast == null) return;
                                  
                                  if (
                              vCurrent == vLast) {
                                      
                              // This was a Quote
                                      
                              Quotes++
                                  } else if (
                              vCurrent vLast) {
                                      
                              // This was a Trade
                                      
                              Trades++
                                  }
                                  
                                  
                              debugPrintln("Volume: " vCurrent);
                                  
                              debugPrintln("Trades: " Trades "  Quotes: " Quotes);
                                  return;

                              Jason K.
                              Project Manager
                              eSignal - an Interactive Data company

                              EFS KnowledgeBase
                              JavaScript for EFS Video Series
                              EFS Beginner Tutorial Series
                              EFS Glossary
                              Custom EFS Development Policy

                              New User Orientation

                              Comment

                              Working...
                              X