Announcement

Collapse
No announcement yet.

Reducing load time for T charts

Collapse
X
 
  • Filter
  • Time
  • Show
Clear All
new posts

  • Reducing load time for T charts

    What's the best way to reduce load time for EFS studies by ignoring any historical points? Guess it doesn't have a "bar" concept, right?

    if (getCurrentBarIndex()<-1) return; // doesn't work on tick charts?
  • #2
    Hello bfry,

    This is working on my end. Try the following.

    PHP Code:
    function preMain() {
        
    setPriceStudy(true);
        
    setStudyTitle("test");
        
    setShowCursorLabel(false);
        
    }

    function 
    main() {
        var 
    vIndex getCurrentBarIndex();
        if (
    vIndex < -1) return;
        
        
    debugPrintln(vIndex);
        return;

    Jason K.
    Project Manager
    eSignal - an Interactive Data company

    EFS KnowledgeBase
    JavaScript for EFS Video Series
    EFS Beginner Tutorial Series
    EFS Glossary
    Custom EFS Development Policy

    New User Orientation

    Comment


    • #3
      Jason, looks like the same thing I have. If you did have a T chart running, then I guess I'm wrong, and it does work to reduce load times. I was judging from the load time, in which I had added some addBand code, and it took MUCH longer to load, but it shouldn't have, because main(...) had the getCurrentBarState() return code at the beginning.

      That's why I was puzzled, since there shouldn't have been any change to the load time for the formula.

      THANKS

      Comment


      • #4
        bfry,

        That is very interesting, do you mind posting so I can look at it and test?

        Regards,

        Comment


        • #5
          Hello bfry,

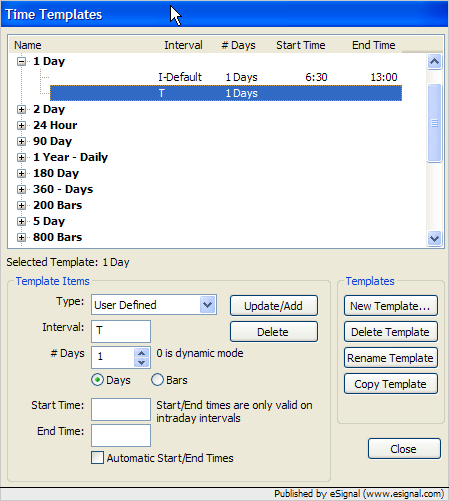
          The reduction in load time may not be that significant with the code example we're using. It depends on how intensive your code in main() is. We don't have a method for preventing the formula from executing completly while the chart is loading. The load time of a "T" chart is going to be more affected by the number of days of data the chart is requesting. It loads tick data in 1-day chunks. You could set up a time template to only load 1 or 2 days of data. Have you tried that?

          Jason K.
          Project Manager
          eSignal - an Interactive Data company

          EFS KnowledgeBase
          JavaScript for EFS Video Series
          EFS Beginner Tutorial Series
          EFS Glossary
          Custom EFS Development Policy

          New User Orientation

          Comment


          • #6
            Jason,

            Wait a minute -- I don't understand why the formula length makes any difference at all.

            Correct me if I'm wrong here, but it is supposed to call main(...) during historical loading, for which the first instruction basically says return when the current bar index is historical, and execute the body of main when loading is finished, right? What am I missing here?

            What portions of the formula execute during loading when the first line of code says return? Are you suggesting that it initializes the formula's outer level variables multiple times, or something like that?

            If the first instruction in main(...) is return, then what does the complexity of the body of the main(...) function in the formula have to do with the load time, for a given number of historical data points?

            Also, I didn't know it was possible to affect the T chart's historical data loading with a template, so I'll look into that again.

            Comment

            Working...
            X