 Tweet
Tweet
Hi..
I was wondering if someone could tell me why this script is not doing what it should...
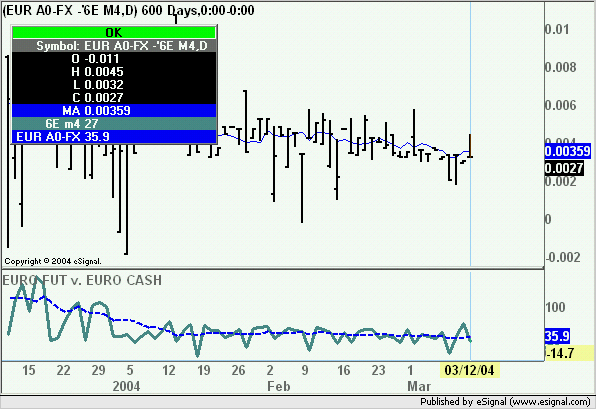
Basically, I am just trying to plot two things in a study.
1. THe difference between two issues (in this case the Euro dollar spot and the Euro CME contract).
2. a 10 period MA of the above.
I have gone over it 50 times and don't know why it doesn't plot.
Help!!
vSym = "6E M4";
vSymC = "EUR A0-FX";
function preMain() {
setPriceStudy(false);
setDefaultBarFgColor(Color.teal, 0);
setDefaultBarThickness(3, 0);
setDefaultBarFgColor(Color.blue, 1);
setDefaultBarThickness(2, 1);
setDefaultBarStyle(PS_DASH,1)
setStudyTitle("EURO FUT v. EURO CASH");
setCursorLabelName(vSym, 0);
setCursorLabelName(vSymC, 1);
}
function main() {
var a = close(0, 1, vSymC);
var b = close(0, 1, vSym);
var c = a - b;
var nLength = 10;
var i;
var vSum = 0.0;
var vValue;
vValue = close(0, -nLength, vSymC) - close(0, -nLength, vSym);
for(i = 0; i < nLength; i++) {
vSum += vValue[i];
} debugPrintln(a, " : ", b, " : ", c);
return new Array (c, Math.round(vSum/nLength));
}
Parker
I was wondering if someone could tell me why this script is not doing what it should...
Basically, I am just trying to plot two things in a study.
1. THe difference between two issues (in this case the Euro dollar spot and the Euro CME contract).
2. a 10 period MA of the above.
I have gone over it 50 times and don't know why it doesn't plot.
Help!!
vSym = "6E M4";
vSymC = "EUR A0-FX";
function preMain() {
setPriceStudy(false);
setDefaultBarFgColor(Color.teal, 0);
setDefaultBarThickness(3, 0);
setDefaultBarFgColor(Color.blue, 1);
setDefaultBarThickness(2, 1);
setDefaultBarStyle(PS_DASH,1)
setStudyTitle("EURO FUT v. EURO CASH");
setCursorLabelName(vSym, 0);
setCursorLabelName(vSymC, 1);
}
function main() {
var a = close(0, 1, vSymC);
var b = close(0, 1, vSym);
var c = a - b;
var nLength = 10;
var i;
var vSum = 0.0;
var vValue;
vValue = close(0, -nLength, vSymC) - close(0, -nLength, vSym);
for(i = 0; i < nLength; i++) {
vSum += vValue[i];
} debugPrintln(a, " : ", b, " : ", c);
return new Array (c, Math.round(vSum/nLength));
}
Parker
Comment