Announcement

Collapse
No announcement yet.

Help with ATR Script

Collapse
X
 
  • Filter
  • Time
  • Show
Clear All
new posts

  • Help with ATR Script

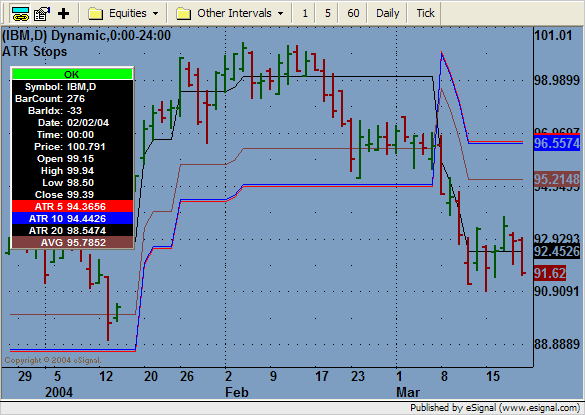
    The following script is suppose to calculate a plot 3 different ATRs and an average of the three. I use a Donchian channel (6 Bar) so I can plot the Daily ATR on a 4 hour chart.

    The script will plot a single ATR without a problem however when I use "return new Array" and try to plot all of the ATRs together I get "0.#Q".

    Please Help


    var AryTTR1 = null;
    var AryTTR2 = null;
    var AryTTR3 = null;
    var iCount1 = 0;
    var iCount2 = 0;
    var iCount3 = 0;

    function preMain() {
    setCursorLabelName("ATR");
    setDefaultBarFgColor(Color.red, 0);
    setDefaultBarFgColor(Color.blue, 1);
    setDefaultBarFgColor(Color.black, 2);
    setDefaultBarFgColor(Color.brown, 3);
    setCursorLabelName("ATR 5", 0);
    setCursorLabelName("ATR 10", 1);
    setCursorLabelName("ATR 20", 2);
    setCursorLabelName("AVG", 3);
    setPriceStudy(false);

    var fp1 = new FunctionParameter("ATRPeriod1", FunctionParameter.NUMBER);
    fp1.setName("SATR1 Period ");
    fp1.setLowerLimit(1);
    fp1.setDefault(5);

    var fp2 = new FunctionParameter("DCHLength1", FunctionParameter.NUMBER);
    fp2.setName("DCH SATR Length");
    fp2.setLowerLimit(1);
    fp2.setDefault(6);

    var fp3 = new FunctionParameter("ATRPeriod2", FunctionParameter.NUMBER);
    fp3.setName("SATR2 Period");
    fp3.setLowerLimit(1);
    fp3.setDefault(10);

    var fp4 = new FunctionParameter("ATRPeriod3", FunctionParameter.NUMBER);
    fp4.setName("SATR3 Period");
    fp4.setLowerLimit(1);
    fp4.setDefault(20);

    var fp5 = new FunctionParameter("Spread", FunctionParameter.NUMBER);
    fp5.setName("Spread");
    fp5.setLowerLimit(.0001);
    fp5.setDefault(.0004);
    }


    function main(DCHLength1, ATRPeriod1, ATRPeriod2, ATRPeriod3, Spread) {
    var vValue1, vValue2, CATR1, CATR2, CATR3, avg;


    if(getBarState() == BARSTATE_ALLBARS){
    myDCHstudy1 = new DonchianStudy(DCHLength1, 0);
    iCount1 = 0;
    iCount2 = 0;
    iCount3 = 0;
    }

    vValue1 = myDCHstudy1.getValue(DonchianStudy.UPPER, 0, -ATRPeriod3);
    vValue2 = myDCHstudy1.getValue(DonchianStudy.LOWER, 0, -ATRPeriod3);

    if (vValue1 == null || vValue2 == null) return;

    if (AryTTR1 == null){
    AryTTR1 = new Array(ATRPeriod1);
    }
    if (AryTTR2 == null){
    AryTTR2 = new Array(ATRPeriod2);
    }
    if (AryTTR3 == null){
    AryTTR3 = new Array(ATRPeriod3);
    }

    var TodayTrueRange1 = vValue1[0] + Spread - vValue2[0];

    if (iCount1 < ATRPeriod1){
    AryTTR1.shift();
    AryTTR1.push(TodayTrueRange1);
    iCount1++;
    return;
    }else{
    var PATR1 = ref(-1); // Perious ATR
    if (PATR1 == null){
    var iSum1=0;
    for(i=0;i<AryTTR1.length;i++){
    iSum1 = iSum1 + AryTTR1[i];
    }
    CATR1 = iSum1/ATRPeriod1;
    //return CATR1;
    }else{
    CATR1 = (PATR1*(ATRPeriod1-1)+TodayTrueRange1)/ATRPeriod1;
    //return CATR1;
    }
    }

    var TodayTrueRange2 = vValue1[0] + Spread - vValue2[0];

    if (iCount2 < ATRPeriod2){
    AryTTR2.shift();
    AryTTR2.push(TodayTrueRange2);
    iCount2++;
    return;
    }else{
    var PATR2 = ref(-1); // Perious ATR
    if (PATR2 == null){
    var iSum2=0;
    for(i=0;i<AryTTR2.length;i++){
    iSum2 = iSum2 + AryTTR2[i];
    }
    CATR2 = iSum2/ATRPeriod2; //return iSum2/ATRPeriod2;
    }else{
    CATR2 = (PATR2*(ATRPeriod2-1)+TodayTrueRange2)/ATRPeriod2;
    //return CATR2;
    }
    }

    var TodayTrueRange3 = vValue1[0] + Spread - vValue2[0];

    if (iCount3 < ATRPeriod3){
    AryTTR3.shift();
    AryTTR3.push(TodayTrueRange3);
    iCount3++;
    return;
    }else{
    var PATR3 = ref(-1); // Perious ATR
    if (PATR3 == null){
    var iSum3=0;
    for(i=0;i<AryTTR1.length;i++){
    iSum3 = iSum3 + AryTTR3[i];
    }
    CATR3 = iSum3/ATRPeriod3; //return iSum3/ATRPeriod3;
    }else{
    CATR3 = (PATR3*(ATRPeriod3-1)+TodayTrueRange3)/ATRPeriod3;
    //return CATR3;
    }
    }

    var avg = (CATR1 + CATR2 + CATR3) / 3;

    return new Array (CATR1, CATR2, CATR3, avg);
    //return CATR1;
    //return CATR2;
    //return CATR3;
    //return avg;
    }

  • #2
    Hello Whatever,

    Here's a solution for you. There were just a couple minor issues. When using the ref() function, the returned result will be an array of data when you are returning an array of data to be plotted on the chart. So you need to reference the array element of the returned result from ref().

    The first execution of your formula will not have a valid return from the ref() function so we need to add a "priming" routine. See how I used the global variable, bPrimed, throughout your formula. You'll see at the end of main() we're setting bPrimed to true after the first execution of main(). Notice also that you only need to use the ref() function once in main() and then just reference the array number of PATR for your calculations of three CATRs.

    Let me know if you have any questions.

    whateverATR.efs

    PHP Code:
    var AryTTR1 null;
    var 
    AryTTR2 null;
    var 
    AryTTR3 null;
    var 
    iCount1 0;
    var 
    iCount2 0;
    var 
    iCount3 0;

    function 
    preMain() {
    setCursorLabelName("ATR");
    setDefaultBarFgColor(Color.red0);
    setDefaultBarFgColor(Color.blue1);
    setDefaultBarFgColor(Color.black2);
    setDefaultBarFgColor(Color.brown3);
    setCursorLabelName("ATR 5"0);
    setCursorLabelName("ATR 10"1);
    setCursorLabelName("ATR 20"2);
    setCursorLabelName("AVG"3);
    setPriceStudy(false);

    var 
    fp1 = new FunctionParameter("ATRPeriod1"FunctionParameter.NUMBER);
    fp1.setName("SATR1 Period ");
    fp1.setLowerLimit(1);
    fp1.setDefault(5);

    var 
    fp2 = new FunctionParameter("DCHLength1"FunctionParameter.NUMBER);
    fp2.setName("DCH SATR Length");
    fp2.setLowerLimit(1);
    fp2.setDefault(6);

    var 
    fp3 = new FunctionParameter("ATRPeriod2"FunctionParameter.NUMBER);
    fp3.setName("SATR2 Period");
    fp3.setLowerLimit(1);
    fp3.setDefault(10);

    var 
    fp4 = new FunctionParameter("ATRPeriod3"FunctionParameter.NUMBER);
    fp4.setName("SATR3 Period");
    fp4.setLowerLimit(1);
    fp4.setDefault(20);

    var 
    fp5 = new FunctionParameter("Spread"FunctionParameter.NUMBER);
    fp5.setName("Spread");
    fp5.setLowerLimit(.0001);
    fp5.setDefault(.0004);
    }

    var 
    myDCHstudy1 null;
    var 
    bPrimed false;

    function 
    main(DCHLength1ATRPeriod1ATRPeriod2ATRPeriod3Spread) {
    var 
    vValue1vValue2CATR1CATR2CATR3avg;


    if(
    getBarState() == BARSTATE_ALLBARS || myDCHstudy1 == null){
    myDCHstudy1 = new DonchianStudy(DCHLength10);
    iCount1 0;
    iCount2 0;
    iCount3 0;
    }

    vValue1 myDCHstudy1.getValue(DonchianStudy.UPPER0, -ATRPeriod3);
    vValue2 myDCHstudy1.getValue(DonchianStudy.LOWER0, -ATRPeriod3);

    if (
    vValue1 == null || vValue2 == null) return;

    if (
    bPrimed == true) var PATR ref(-1);

    if (
    AryTTR1 == null){
    AryTTR1 = new Array(ATRPeriod1);
    }
    if (
    AryTTR2 == null){
    AryTTR2 = new Array(ATRPeriod2);
    }
    if (
    AryTTR3 == null){
    AryTTR3 = new Array(ATRPeriod3);
    }

    var 
    TodayTrueRange1 vValue1[0] + Spread vValue2[0];

    if (
    iCount1 ATRPeriod1){
    AryTTR1.shift();
    AryTTR1.push(TodayTrueRange1);
    iCount1++;
    return;
    }else{
    var 
    PATR1 null;
    if (
    bPrimed == truePATR1 PATR[0]; // Perious ATR
    //debugPrintln(PATR1);    // returning NaN (Not a Number)
    if (PATR1 == null){
        var 
    iSum1=0;
        for(
    i=0;i<AryTTR1.length;i++){
            
    iSum1 iSum1 AryTTR1[i];
        }
        
    CATR1 iSum1/ATRPeriod1;
        
    //return CATR1;
    }else{
        
    CATR1 = (PATR1*(ATRPeriod1-1)+TodayTrueRange1)/ATRPeriod1;
        
    //debugPrintln(CATR1);    // returning NaN (Not a Number)
        //return CATR1;
    }
    }

    var 
    TodayTrueRange2 vValue1[0] + Spread vValue2[0];

    if (
    iCount2 ATRPeriod2){
    AryTTR2.shift();
    AryTTR2.push(TodayTrueRange2);
    iCount2++;
    return;
    }else{
    var 
    PATR2 null;
    if (
    bPrimed == truePATR2 PATR[1]; // Perious ATR
    if (PATR2 == null){
    var 
    iSum2=0;
    for(
    i=0;i<AryTTR2.length;i++){
    iSum2 iSum2 AryTTR2[i];
    }
    CATR2 iSum2/ATRPeriod2//return iSum2/ATRPeriod2;
    }else{
    CATR2 = (PATR2*(ATRPeriod2-1)+TodayTrueRange2)/ATRPeriod2;
    //return CATR2;
    }
    }

    var 
    TodayTrueRange3 vValue1[0] + Spread vValue2[0];

    if (
    iCount3 ATRPeriod3){
    AryTTR3.shift();
    AryTTR3.push(TodayTrueRange3);
    iCount3++;
    return;
    }else{
    var 
    PATR3 null;
    if (
    bPrimed == truePATR3 PATR[2]; // Perious ATR
    if (PATR3 == null){
    var 
    iSum3=0;
    for(
    i=0;i<AryTTR1.length;i++){
    iSum3 iSum3 AryTTR3[i];
    }
    CATR3 iSum3/ATRPeriod3//return iSum3/ATRPeriod3;
    }else{
    CATR3 = (PATR3*(ATRPeriod3-1)+TodayTrueRange3)/ATRPeriod3;
    //return CATR3;
    }
    }

    var 
    avg = (CATR1 CATR2 CATR3) / 3;

    if (
    bPrimed == falsebPrimed true;

    return new Array (
    CATR1CATR2CATR3avg);
    //return CATR1;
    //return CATR2;
    //return CATR3;
    //return avg;

    Jason K.
    Project Manager
    eSignal - an Interactive Data company

    EFS KnowledgeBase
    JavaScript for EFS Video Series
    EFS Beginner Tutorial Series
    EFS Glossary
    Custom EFS Development Policy

    New User Orientation

    Comment


    • #3
      Thank you Jason. It works perfectly.

      I have another problem and question about the same script; to which I added a few lines trying to display ATR Stops.

      I can't figure out why the calculations are so off.

      Here is the code.

      var AryTTR1 = null;
      var AryTTR2 = null;
      var AryTTR3 = null;
      var iCount1 = 0;
      var iCount2 = 0;
      var iCount3 = 0;
      var Stop1, Stop2, Stop3, StopA;

      function preMain() {
      setCursorLabelName("ATR Stops");
      setStudyTitle("ATR Stops");
      setDefaultBarFgColor(Color.red, 0);
      setDefaultBarFgColor(Color.blue, 1);
      setDefaultBarFgColor(Color.black, 2);
      setDefaultBarFgColor(Color.brown, 3);
      setCursorLabelName("ATR 5", 0);
      setCursorLabelName("ATR 10", 1);
      setCursorLabelName("ATR 20", 2);
      setCursorLabelName("AVG", 3);
      setPriceStudy(true);

      var fp1 = new FunctionParameter("ATRPeriod1", FunctionParameter.NUMBER);
      fp1.setName("SATR1 Period ");
      fp1.setLowerLimit(1);
      fp1.setDefault(5);

      var fp2 = new FunctionParameter("DCHLength1", FunctionParameter.NUMBER);
      fp2.setName("DCH SATR Length");
      fp2.setLowerLimit(1);
      fp2.setDefault(6);

      var fp3 = new FunctionParameter("ATRPeriod2", FunctionParameter.NUMBER);
      fp3.setName("SATR2 Period");
      fp3.setLowerLimit(1);
      fp3.setDefault(10);

      var fp4 = new FunctionParameter("ATRPeriod3", FunctionParameter.NUMBER);
      fp4.setName("SATR3 Period");
      fp4.setLowerLimit(1);
      fp4.setDefault(20);

      var fp5 = new FunctionParameter("Spread", FunctionParameter.NUMBER);
      fp5.setName("Spread");
      fp5.setLowerLimit(.0001);
      fp5.setDefault(.0004);

      var fp6 = new FunctionParameter("DCHLength", FunctionParameter.NUMBER);
      fp6.setName("DCH Length");
      fp6.setLowerLimit(1);
      fp6.setDefault(30);

      var fp7 = new FunctionParameter("Multi", FunctionParameter.NUMBER);
      fp7.setName("ATR *");
      fp7.setLowerLimit(0);
      fp7.setDefault(1);
      }

      var myDCHstudy1 = null;
      var bPrimed = false;
      var myDCHstudy2 = null;

      function main(DCHLength, Multi, DCHLength1, ATRPeriod1, ATRPeriod2, ATRPeriod3, Spread) {
      var vValue1, vValue2, vValue3, vValue4, CATR1, CATR2, CATR3, avg;


      if(getBarState() == BARSTATE_ALLBARS || myDCHstudy1 == null || myDCHstudy2 == null){
      myDCHstudy1 = new DonchianStudy(DCHLength1, 0);
      myDCHstudy2 = new DonchianStudy(DCHLength, 0);
      iCount1 = 0;
      iCount2 = 0;
      iCount3 = 0;
      }

      vValue1 = myDCHstudy1.getValue(DonchianStudy.UPPER);
      vValue2 = myDCHstudy1.getValue(DonchianStudy.LOWER);
      vValue3 = myDCHstudy2.getValue(DonchianStudy.UPPER, 0, -2);
      vValue4 = myDCHstudy2.getValue(DonchianStudy.LOWER, 0, -2);
      if (vValue1 == null || vValue2 == null || vValue3 == null || vValue4 == null) return;

      if (bPrimed == true) var PATR = ref(-1);

      if (AryTTR1 == null){
      AryTTR1 = new Array(ATRPeriod1);
      }
      if (AryTTR2 == null){
      AryTTR2 = new Array(ATRPeriod2);
      }
      if (AryTTR3 == null){
      AryTTR3 = new Array(ATRPeriod3);
      }

      var TodayTrueRange = (vValue1 + Spread - vValue2);

      if (iCount1 < ATRPeriod1){
      AryTTR1.shift();
      AryTTR1.push(TodayTrueRange);
      iCount1++;
      return;
      }else{
      var PATR1 = null;
      if (bPrimed == true) PATR1 = PATR[0];
      if (PATR1 == null){
      var iSum1=0;
      for(i=0;i<AryTTR1.length;i++){
      iSum1 = iSum1 + AryTTR1[i];
      }
      CATR1 = iSum1/ATRPeriod1;
      }else{
      CATR1 = (PATR1*(ATRPeriod1-1)+TodayTrueRange)/ATRPeriod1;
      }
      }

      if (iCount2 < ATRPeriod2){
      AryTTR2.shift();
      AryTTR2.push(TodayTrueRange);
      iCount2++;
      return;
      }else{
      var PATR2 = null;
      if (bPrimed == true) PATR2 = PATR[1];
      if (PATR2 == null){
      var iSum2=0;
      for(i=0;i<AryTTR2.length;i++){
      iSum2 = iSum2 + AryTTR2[i];
      }
      CATR2 = iSum2/ATRPeriod2;
      }else{
      CATR2 = (PATR2*(ATRPeriod2-1)+TodayTrueRange)/ATRPeriod2;
      }
      }

      if (iCount3 < ATRPeriod3){
      AryTTR3.shift();
      AryTTR3.push(TodayTrueRange);
      iCount3++;
      return;
      }else{
      var PATR3 = null;
      if (bPrimed == true) PATR3 = PATR[2];
      if (PATR3 == null){
      var iSum3=0;
      for(i=0;i<AryTTR1.length;i++){
      iSum3 = iSum3 + AryTTR3[i];
      }
      CATR3 = iSum3/ATRPeriod3;
      }else{
      CATR3 = (PATR3*(ATRPeriod3-1)+TodayTrueRange)/ATRPeriod3;
      }
      }

      var avg = (CATR1 + CATR2 + CATR3) / 3;


      if (close() > vValue3[1]){
      Stop1 = vValue3[0] - CATR1 * Multi;
      Stop2 = vValue3[0] - CATR2 * Multi;
      Stop3 = vValue3[0] - CATR3 * Multi;
      StopA = vValue3[0] - avg * Multi;
      }

      if (close() < vValue4[1]){
      Stop1 = vValue4[0] + CATR1 * Multi;
      Stop2 = vValue4[0] + CATR2 * Multi;
      Stop3 = vValue4[0] + CATR3 * Multi;
      StopA = vValue4[0] + avg * Multi;
      }


      if (bPrimed == false) bPrimed = true;

      return new Array (Stop1, Stop2, Stop3, StopA);
      }

      Comment


      • #4
        Hello Whatever,

        You changed your return array in main(). The calculations for CATR1, 2 and 3 are dependant on their previous values, which are no longer being returned to your chart. So when you do the PATR = ref(-1) your using the previous values of Stop1, 2 and 3 in the subsequent calculations for CATR1, 2 and 3. I think that is the problem. Please describe what you're trying to accomplish and I'll try to give you some suggestions.
        Jason K.
        Project Manager
        eSignal - an Interactive Data company

        EFS KnowledgeBase
        JavaScript for EFS Video Series
        EFS Beginner Tutorial Series
        EFS Glossary
        Custom EFS Development Policy

        New User Orientation

        Comment


        • #5
          Jason,

          What I am trying to do is take the different ATRs and add/subtract them to a Donchian Channel to create a stop level. However the condition that must be meet to create a stop is that the current closing price has to close above or below the previous Donchian value. A wick that moves the channel is not valid and should not be used to create a stop.

          Logic;


          if (close() > vValue3[1]){
          Stop1 = vValue3[0] - CATR1 * Multi;
          Stop2 = vValue3[0] - CATR2 * Multi;
          Stop3 = vValue3[0] - CATR3 * Multi;
          StopA = vValue3[0] - avg * Multi;
          }

          if (close() < vValue4[1]){
          Stop1 = vValue4[0] + CATR1 * Multi;
          Stop2 = vValue4[0] + CATR2 * Multi;
          Stop3 = vValue4[0] + CATR3 * Multi;
          StopA = vValue4[0] + avg * Multi;
          }

          vValue3[] = Donchian Upper
          vValue3[] = Donchian Lower

          I have attached a Simple ATR script that does what I would like the Exponential ATR to do.

          Hope this helps.

          Thanks
          Attached Files

          Comment


          • #6
            Hello Whatever,

            This formula, whateverATR2.efs, should get you going. Your previous formula was a non-price study returning the values of your ATRs to the chart. With your stop logic, we now need a price study. Therefore we don't need to return the ATR values to the chart and use ref() to reference their values on the previous bar. Instead we can just make PATR and the CATR1-3 global variables so we can store them ourselves in the PATR array and avoid using ref() altogether. We can accomplish this with the BARSTATE_NEWBAR routine on lines 78-82. Now you can return your stop values to the price window and you should be good to go. Let me know if this helped.

            Jason K.
            Project Manager
            eSignal - an Interactive Data company

            EFS KnowledgeBase
            JavaScript for EFS Video Series
            EFS Beginner Tutorial Series
            EFS Glossary
            Custom EFS Development Policy

            New User Orientation

            Comment


            • #7
              Jason,

              Thank you for your help. I greatly appreciate it.

              There seems to be a problem with the ATR added to the Donchian Channel logic. I have spent the weekend looking at it and have been unable to determine the problem. I have posted the following screen shot.

              As you can see I have both SART (Simple Average True Range) and ATR (exponential Average True Range). You will notice that the bottom bottom four ATR values are within 10 pips of each other and are within the SART values. However on the Chart the Stop lines are spread out instead of close together.

              I know that the problem is not in the calculation of the ATR values but in the adding or subtracting to the Donchian Channel.

              Thanks
              Attached Files

              Comment


              • #8
                Hello Whatever,

                At this point, I don't see anything that is "wrong" with your formula. It sounds like the results are just not meeting your expectations. Here are a couple things you might want to consider. Your variable, Multi, is set to a default of 1. You could change the default to something less than 1, which would tighten up the returned results. Also, I notice that you are adding/subtracting from the Donchian values from -2 bars ago. Why not use the current bar's Donchian values, vValue1 and 2? Without knowing the theory behind what you're trying to accomplish it's hard to say what you need to do. I would run the same Donchian study in another chart so you can easily look up the values for each bar and plug in the numbers to your stop calculation manually to verify that your math equation is giving you the results you're expecting. Hope this helps.
                Jason K.
                Project Manager
                eSignal - an Interactive Data company

                EFS KnowledgeBase
                JavaScript for EFS Video Series
                EFS Beginner Tutorial Series
                EFS Glossary
                Custom EFS Development Policy

                New User Orientation

                Comment


                • #9
                  I know that appears to be working properly but if you will look at the picture below you will see that the SATR "AVG" (3rd brown band in the cursor window) value is 166 and the ATR "AVG" (4th brown band in the cursor window) value is 167. Therefore the two brown line on the graph should be drawn so closely you should not be able to distinguish between the two. But if you will notice that the one brown line (ATR "AVG") is drawn almost through the middle of the candles. While the other brown line (SATR "AVG") is drawn correctly.

                  The ATR calculations are correct but the error is occurring when that value is added or subtracted to the Donchian value. The ATR value should be added or subtracted to the last Donchian value that closed above the previous Donchian value. If you look at the "satr 3 avg stops .efs" script attached below you will see what I am trying to accomplish with the ATR script.

                  Sorry this is taking so long to work out but I do appreciate your help
                  Thanks

                  Comment

                  Working...
                  X