 Tweet
Tweet
Re: Reply to post 'adx....'
Michael
I believe the problem is consistent with those in this thread...
In part it is the same problem except that in the case of the adxdm.efs I was actually able to create the expression in FW by forcing it into the Returned Data Points.
Using the Editor look at the efs and in Line48 you should see the following expression
return vADXDM.getValue(ADXDMStudy.PDI)-vADXDM.getValue(ADXDMStudy.NDI)
That is what creates the histogram but if you open the same efs with FW it does not acknowledge it and in the Returned Data Points you will see only vADXDM.getValue(ADXDMStudy.PDI).
If you were creating the efs just as an indicator then you can actually fool the FW into accepting the expression.
Just as an experiment try the following:
In the Returned Data Points highlight the expression
vADXDM.getValue(ADXDMStudy.PDI)
Then hit Ctrl+C (for Copy) on your keyboard
Now place the cursor at the very end of that expression
Type - (minus sign) and hit Ctlr+V (for Paste)
You will notice that the second variable of the expression is the same as the first though.
So go to the end of the whole expression and navigate to where it has the second .PDI and place the cursor to the right of the P.
Backspace and type N.
Now you have the whole correct expression in the Returned Data Points box and FW will save it as such.
This is what I meant by "jumping through hoops" in one of my messages in this thread.
Now, if at this point you try to do anything else in FW it will delete the expression in Returned Data Points and just leave the PDI variable of the DM, so you will be back at square one.
But, you can still create the blueprint of the strategy using FW - where it will be easier to do - and then edit it with the Editor.
Therefore we know that the FW will only recognize one variable of the expression for example this one
vADXDM.getValue(ADXDMStudy.PDI).
We also know that the expression we really want is this one
vADXDM.getValue(ADXDMStudy.PDI)-vADXDM.getValue(ADXDMStudy.NDI)
So in the FW create the Sets for the conditions just using
vADXDM.getValue(ADXDMStudy.PDI).
So Set1 will have the conditions as in the following image
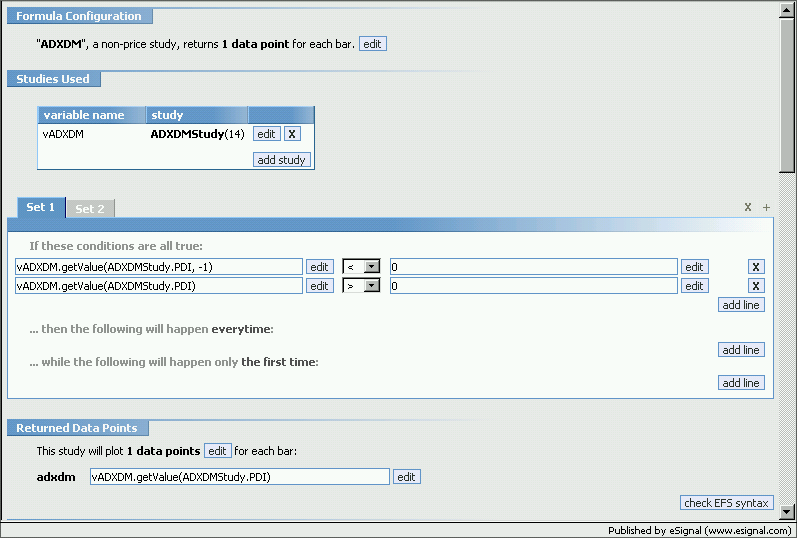
where IF vADXDM.getValue(ADXDMStudy.PDI,-1) of the prior bar is < 0 AND IF vADXDM.getValue(ADXDMStudy.PDI) of the current bar is > 0 (ie you have a crossing up of 0) THEN apply whatever strategy you want ie doLong at this bar, next bar, etc.
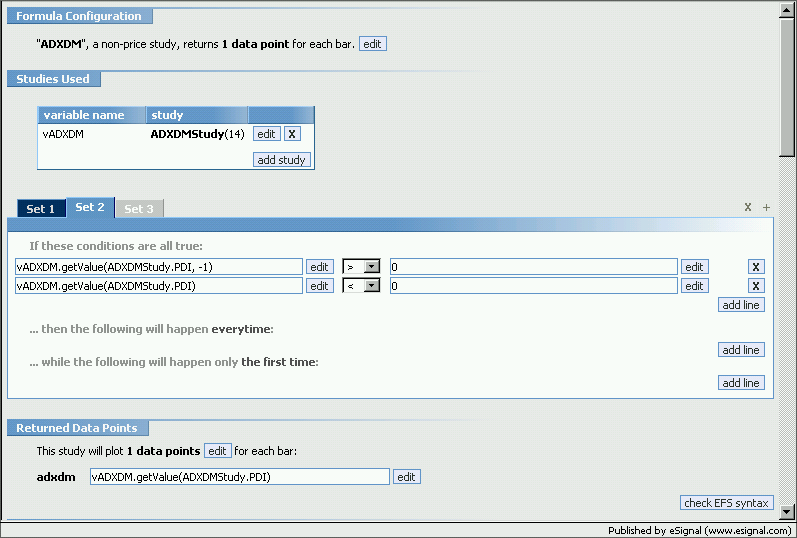
In Set2 you will do the opposite where IF the PDI,-1 >0 and the PDI <0 as in the following image.
This is for the crossing down. Again apply your strategy.
At this point save the formula even though the efs is clearly wrong.
Now open the saved efs with the Editor and where you see
vADXDM.getValue(ADXDMStudy.PDI,-1)
cut and paste the following
vADXDM.getValue(ADXDMStudy.PDI,-1)-vADXDM.getValue(ADXDMStudy.NDI,-1)
and where you see
vADXDM.getValue(ADXDMStudy.PDI)
cut and paste the following
vADXDM.getValue(ADXDMStudy.PDI)-vADXDM.getValue(ADXDMStudy.NDI)
Remember to also adjust the expression in the return line in function main() as that is what plots the indicator.
Note: I have not actually verified that the above process works with this specific efs, but I have applied the same process in another efs and it did work.
Anyhow Dion has acknowledged that future iterations of the FW will have to include user defined variables and expressions in some form or another.
For now this is the "creative" cut and paste that David Loomis was referring to in one of his replies in the same thread you pointed to in the beginning of your message.
Hope this helps
Alex
Michael
I believe the problem is consistent with those in this thread...
In part it is the same problem except that in the case of the adxdm.efs I was actually able to create the expression in FW by forcing it into the Returned Data Points.
Using the Editor look at the efs and in Line48 you should see the following expression
return vADXDM.getValue(ADXDMStudy.PDI)-vADXDM.getValue(ADXDMStudy.NDI)
That is what creates the histogram but if you open the same efs with FW it does not acknowledge it and in the Returned Data Points you will see only vADXDM.getValue(ADXDMStudy.PDI).
If you were creating the efs just as an indicator then you can actually fool the FW into accepting the expression.
Just as an experiment try the following:
In the Returned Data Points highlight the expression
vADXDM.getValue(ADXDMStudy.PDI)
Then hit Ctrl+C (for Copy) on your keyboard
Now place the cursor at the very end of that expression
Type - (minus sign) and hit Ctlr+V (for Paste)
You will notice that the second variable of the expression is the same as the first though.
So go to the end of the whole expression and navigate to where it has the second .PDI and place the cursor to the right of the P.
Backspace and type N.
Now you have the whole correct expression in the Returned Data Points box and FW will save it as such.
This is what I meant by "jumping through hoops" in one of my messages in this thread.
Now, if at this point you try to do anything else in FW it will delete the expression in Returned Data Points and just leave the PDI variable of the DM, so you will be back at square one.
But, you can still create the blueprint of the strategy using FW - where it will be easier to do - and then edit it with the Editor.
Therefore we know that the FW will only recognize one variable of the expression for example this one
vADXDM.getValue(ADXDMStudy.PDI).
We also know that the expression we really want is this one
vADXDM.getValue(ADXDMStudy.PDI)-vADXDM.getValue(ADXDMStudy.NDI)
So in the FW create the Sets for the conditions just using
vADXDM.getValue(ADXDMStudy.PDI).
So Set1 will have the conditions as in the following image
where IF vADXDM.getValue(ADXDMStudy.PDI,-1) of the prior bar is < 0 AND IF vADXDM.getValue(ADXDMStudy.PDI) of the current bar is > 0 (ie you have a crossing up of 0) THEN apply whatever strategy you want ie doLong at this bar, next bar, etc.
In Set2 you will do the opposite where IF the PDI,-1 >0 and the PDI <0 as in the following image.
This is for the crossing down. Again apply your strategy.
At this point save the formula even though the efs is clearly wrong.
Now open the saved efs with the Editor and where you see
vADXDM.getValue(ADXDMStudy.PDI,-1)
cut and paste the following
vADXDM.getValue(ADXDMStudy.PDI,-1)-vADXDM.getValue(ADXDMStudy.NDI,-1)
and where you see
vADXDM.getValue(ADXDMStudy.PDI)
cut and paste the following
vADXDM.getValue(ADXDMStudy.PDI)-vADXDM.getValue(ADXDMStudy.NDI)
Remember to also adjust the expression in the return line in function main() as that is what plots the indicator.
Note: I have not actually verified that the above process works with this specific efs, but I have applied the same process in another efs and it did work.
Anyhow Dion has acknowledged that future iterations of the FW will have to include user defined variables and expressions in some form or another.
For now this is the "creative" cut and paste that David Loomis was referring to in one of his replies in the same thread you pointed to in the beginning of your message.
Hope this helps
Alex
Comment