Announcement

Collapse
No announcement yet.

Usage of Daily indexes and values including drawing lines

Collapse
X
 
  • Filter
  • Time
  • Show
Clear All
new posts

  • Usage of Daily indexes and values including drawing lines

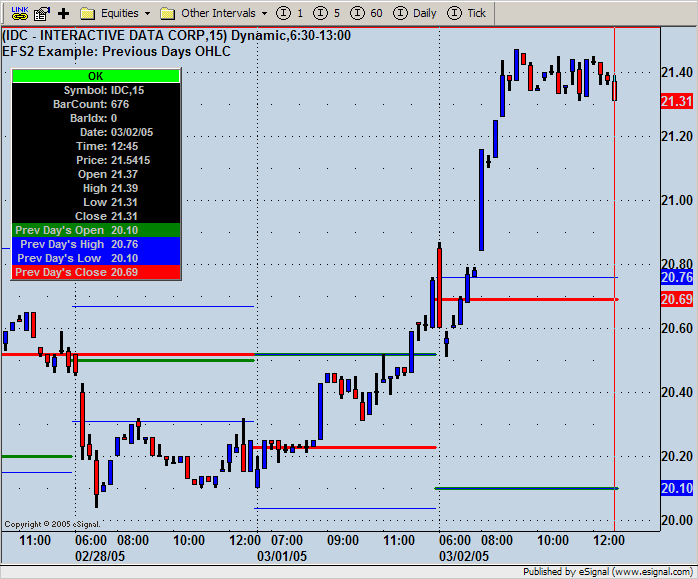
    I have been working on a script to provide various daily pivot values where various variants have already been posted by eSignal and others to provide OHLC (today and previous day values), trader pivots (PP, R1, S1, R2, S2) and the like. However I have been looking to have some more information and additional flexibility.

    There have been a number of issues that I have come across that either I am ignorant how to resolve or maybe that functionality does not exist in current efs scripting:-

    1. Finding first bar indexes of any days before yesterday

    Code fragment

    tNowM = getValue("rawtime");
    nTdyIdxM = Math.abs( getFirstBarIndexOfDay(tNowM) );
    tYdyM = getPreviousTradingDay(tNowM) ;
    if(tYdyM != null){
    nYdyIdxM = Math.abs( getFirstBarIndexOfDay(tYdyM) );
    }

    Now you are able to draw lines from the index value (specifically the first bar of today or yesterday) to the current position for any OHLC values and/or extract various pivots based on a vast array of pivot formulae if desired and project that to the current day. What would be the method to find the indexes of any days before yesterday's?

    2. Finding the specific bar index of specific events during the day.

    I would like to pinpoint the high and low of any trading day so that a line is drawn (intraday) from that bar index to the current index, how can this be done? Currently I have lines drawn from the first bar of the day either todays or yesterdays. I want to achieve this without resorting to further coding for intraday action.

    3. Adjusting the open & close

    With stocks, extracting daily OHLC values is normally satisfactory as they more or less match cash trading hours values (ie all pre and post market values are ignored).

    However in continuous futures such as indexes, the open & close values are not what is normally desired in order to derive pivot information intraday, even though the daily information is technically correct which includes all trading action (ie opposite to what is provided by stocks).

    You are then forced to look to intraday data to extract appropriate open/close data during cash open hours, this imposes more coding and a great performance hit. Changing the time template has no effect. It would be nice if there was a simple function built into efs to get this data easily without having to resort to complicated coding.

    Specifically I want to see the whole data set in continuous futures, but be able to call the open and close at specific times to match the cash market hours.

    If anyone has any suggestions and/or thoughts on these matters I would appreciate any feedback.

    Robert

  • #2
    Hello Robert,

    Here’s some info that may be helpful to you.

    1. This is a code snippet of how I would get the array of indexes for all the days loaded in a chart. If you need the index values to update during real time you’ll need to do 1 of 2 things. Loop through aFirstIndex array and subtract 1 for each index value at the instance of each new bar in real time (at bar 0) or loop through the aFirstIndex and use the dates stored in aDates to call getFirstBarIndexOfDay() and update each array element of aFirstIndex as needed. Element [0] of these two arrays will be the most recent day.

    PHP Code:
    var aFirstIndex = new Array();
    var 
    aDates = new Array();

    function 
    main() {
        var 
    nState getBarState();
        
        if (
    getDay(0) != getDay(-1) && nState == BARSTATE_NEWBAR) {
            var 
    vDate getValue("Time");
            var 
    nIndex getFirstBarIndexOfDay(vDate);
            
    aFirstIndex.unshift(nIndex);
            
    aDates.unshift(vDate);
            
    debugPrintln(getValue("Time") + "  First Index: " nIndex);
        }
        
        return;

    2. Here’s another code example to base your routine on. This will collect the high/low of each day as the chart is loading and store the index values of those bars in an array. You can then use the values in the Index arrays to draw the lines you need. The code also updates the index values in real time as new bars come into the chart if you need to keep updating any lines in real time.

    PHP Code:
    var vH null;
    var 
    vL null;
    var 
    aHigh = new Array();
    var 
    aHighIndex = new Array();
    var 
    aLow = new Array;
    var 
    aLowIndex = new Array();

    var 
    bShow false;
    var 
    bLoaded false;

    function 
    main() {
        var 
    nState getBarState();
        var 
    nIndex getCurrentBarIndex();
        
        if (
    nIndex 0) {  // chart is loading, collect data
            
    if (getDay(0) != getDay(-1)) {
                
    vH high();
                
    vL low();
                
    aHigh.unshift(vH);
                
    aLow.unshift(vL);
                
    aHighIndex.unshift(nIndex);
                
    aLowIndex.unshift(nIndex);
            }
            if (
    high() >= vH) {
                
    vH high();
                
    aHigh[0] = vH;
                
    aHighIndex[0] = nIndex;
            }
            if (
    low() <= vL) {
                
    vL low();
                
    aLow[0] = vL;
                
    aLowIndex[0] = nIndex;
            }
        } else {
            if (
    nState == BARSTATE_NEWBAR && bLoaded == true) {  // update indexes in real time
                
    var nLen aHigh.length;
                for (
    0nLen; ++i) {
                    
    aHighIndex[i] -= 1;
                    
    aLowIndex[i] -= 1;
                }
            }
        }
        
        if (
    nIndex == && bLoaded == falsebLoaded true;
        
        if (
    bShow == false && nIndex == 0) {
            
    bShow true;
            
    debugPrintln("Highs: " aHigh);
            
    debugPrintln("Highs Index: " aHighIndex);
            
    debugPrintln("Lows: " aLow);
            
    debugPrintln("Lows Index: " aLowIndex);
            
    bShow true;
        }
        
        return;


    3. Unfortunately, there isn’t an easy solution for this, as you’ve discovered. The best thing you could do is submit a suggestion to development at [email protected] to create a new function to handle this.
    Jason K.
    Project Manager
    eSignal - an Interactive Data company

    EFS KnowledgeBase
    JavaScript for EFS Video Series
    EFS Beginner Tutorial Series
    EFS Glossary
    Custom EFS Development Policy

    New User Orientation

    Comment


    • #3
      Jason,

      Thank you for your reply and code suggestions. Unfortunately the information is not exactly what I was looking for (although it may have confirmed that I cannot do what I really want to without a lot of coding). Using the getDay function relies on the intraday time template to extract the relevant day data which is severely limited if you limit the number of bars loaded. This limitation is not in force when you access the day data using the following coding fragment within intraday charts (sorry that I was not more specific in my initial posting):-

      sDaySymG = getSymbol().toUpperCase()+",D";

      nDayPHiG = getValueAbsolute( "High", -1, sDaySymG );
      nDayPLoG = getValueAbsolute( "Low", -1, sDaySymG );

      The -1 value can be any number to retrieve data 1, 10 days ago or whatever, which is completely independent of the intraday time template.

      However using this technique does not get you the bar index value (only the price value) within the intraday chart. In order to draw lines and the like to the current bar, you have to the use the technique as described in my original posting:-

      tNowM = getValue("rawtime");
      nTdyIdxM = Math.abs( getFirstBarIndexOfDay(tNowM) );
      tYdyM = getPreviousTradingDay(tNowM) ;
      if(tYdyM != null){
      nYdyIdxM = Math.abs( getFirstBarIndexOfDay(tYdyM) );
      }

      However here you can only access index values to yesterday only. I was looking for a way to extend this technique to access the first bar value within the intraday chart for any day prior to yesterday but only using the getPreviousTradingDay function. However I can see that if insufficient intraday data exists, then it will not be possible to find the relevant bar index value, in this instance I would still like the line to be drawn (ie from the first bar of the price data).


      As to the second requirement, I face the same dilemma concerning extracting daily price data from intraday day which has an insufficient data set.

      In conclusion, I just want to know can "getPreviousTradingDay" function be extended, if not, then I will have to merge 2 different techniques:-

      1. Extract OHLC price data from a daily data set using getSymbol().toUpperCase()+",D" as this is completely independent of the intraday price data set.

      2. If sufficient intraday data exists, utilize either the getDay or getPreviousTradingDay functions in combination with getFirstBarIndexOfDay and/or getCurrentBarIndex and/or some form of bar counter technique, to match the daily price data to a specific intraday bar index value in order to draw lines from that index to the current index. However this involves complex coding as you have already provided plus a performance hit.

      3. If insufficient intraday data exists then just draw the line or even use something like addBand from first bar of dataset to current bar of dataset. Again this will be an offshoot of 2 above and again require complex coding & a further performace hit.

      It would be nice if all of this was reduced to a simple function call within eSignal. Anyway after I get some further thoughts on the
      getPreviousTradingDay function, I will send an email with my suggestions.

      One final comment is the use of getValue("Time") . I was always informed that to reduce system usage, it was better to use getValue("rawtime"), is that no longer the case?

      Robert
      Last edited by rcameron; 03-30-2004, 04:56 AM.

      Comment


      • #4
        Hello Robert,

        The routine you’re trying to create isn’t a simple one. Here’s another idea for you to try. Have you tried using getPrevDaysOHLC.efs? This will give you a single day’s daily OHLC data or an array of daily data that you can then use in your intraday chart that is independent of your current intraday time template. Then you could use getOldestBarIndex() to draw the pivot lines from the beginning of your chart data to the current bar. You would still need to use the code example I gave you to store the first bar index values and dates for the data in your intraday chart. You would also need to use getPrevDaysOHLC.efs and pass “Time” as the price source to get the corresponding dates of the previous days. Or use a combination of calls to getPrevDaysOHLC.efs passing “day,” “month” and “year” to build date strings to store in another dates array. Once you have these two arrays (price and dates) for the daily data from getPrevDaysOHLC.efs, then loop through and compare the dates from the getPrevOHLC.efs date array to the dates in your aDates (see previous code example) array. If you get a date match, use the corresponding index value from aFirstIndex (see previous code example) to draw the pivot lines. If a date match is not found, it means the daily data from the getPrevDaysOHLC.efs is not part of your current chart’s intraday data set. In that case, you would use getOldestBarIndex() to draw these pivots from the beginning of your chart’s data. I know this may sound a little complicated, but it’s the best idea I could come up with.

        I’m not sure what you’re expecting by extending getPreviousTradingDay( Date ). You can pass any date to it and it will give you the previous trading day’s date.

        With the arrival of EFS2, there will be some better bar mapping routines that will make this type of coding much simpler. I don’t have any specifics on this, but I know it’s being worked on.

        Yes, getValue(“rawtime”) is still more efficient than getValue(“Time”).
        Jason K.
        Project Manager
        eSignal - an Interactive Data company

        EFS KnowledgeBase
        JavaScript for EFS Video Series
        EFS Beginner Tutorial Series
        EFS Glossary
        Custom EFS Development Policy

        New User Orientation

        Comment


        • #5
          Jason,

          I see what I have to do now to get things working for now. Thank you for all your help and advice, it is much appreciated.

          It would be nice to see all this complicated coding reduced to simple function calls to built in internal functions provided by eSignal which should considerably speed up development and ensure fastest performance. Hopefully we will see that in EFS2 which I am currently involved with testing a subset on intraday price extraction from a lower to higher timeframe.

          I will forward my thoughts to the development team on daily price extraction within intraday charts to hopefully get things simple but powerful at the same time. I do like coding, but much prefer trading my ideas in the fastest and most reliable way possible and to make some money!

          Robert

          Comment


          • #6
            EFS2 Example - Previous Day's OHLC on intraday chart.

            Hello All,

            Here's a preview of how EFS2 is going to help make pivot studies a breeze. Review this thread and take a look at all the code that we need to write currently in order to draw previous day's OHLC data on an intraday chart. Then compare to the example below of how we will do this with EFS2 in 7.9.

            PHP Code:
            function main() {
                var 
            vSymbol     getSymbol() + ",D";
                var 
            nOpen1      open(-1sym(vSymbol));
                var 
            nHigh1      high(-1sym(vSymbol));
                var 
            nLow1       low(-1sym(vSymbol));
                var 
            nClose1     close(-1sym(vSymbol));

                return new Array(
            nOpen1nHigh1nLow1nClose1);


            The key here is the data series function, sym(SymInv). The usage of this series function eliminates the users need to manually code the synchronization routines between the two intervals. The complete formula is attached, but it will only work with 7.9 of course.

            Attached Files
            Jason K.
            Project Manager
            eSignal - an Interactive Data company

            EFS KnowledgeBase
            JavaScript for EFS Video Series
            EFS Beginner Tutorial Series
            EFS Glossary
            Custom EFS Development Policy

            New User Orientation

            Comment

            Working...
            X