I need assistance to write an indicator which is the Stochastic RSI multiplied by a moving average of the volume. I have no idea how to do this and The Formula Wizard does not have Stochastic RSI. I would like to have the ability to edit all the parameters of the StochasticRSI and the volume moving average. Any help would be much appreciated.
Announcement
Collapse
No announcement yet.
Indicator assistance
Collapse
X
-
Hi Linsar,
You may want to check with one of the EFS Consultants that are available to assist with designing and constructing custom built studies. You may also want to check out some of the introductory videos regarding how to use the EFS Formula Wizard, specifically section VI of the training videos. I hope this helps.
-
Have I posted this request in the wrong forum? Should it be in the EF Studies? I read numerous requests for assistance (many like myself who are not programming experts) and it appears that assistance is rendered by many. Yet I am directed to development. Please explain.
Comment
-
Hi,
I have moved this thread to a better forum for your purposes. The other forum is designed for users to tell us what studies they'd like to see us design and include in future versions of eSignal. Custom work, like yours, is better suited for this forum where other users routinely offer help.
I think Duane was simply pointing out that the most direct way to get your indicator written would be to use one of our EFS consultants. Hopefully, some users will chime in here and offer their assistance.
Thanks.
Comment
-
linsar
The attached efs uses the StochRSI created by JasonK and multiplies it by the MA of Volume.
All parameters for the RSI, Stochastic and MA of Volume can be modified through Edit Studies.
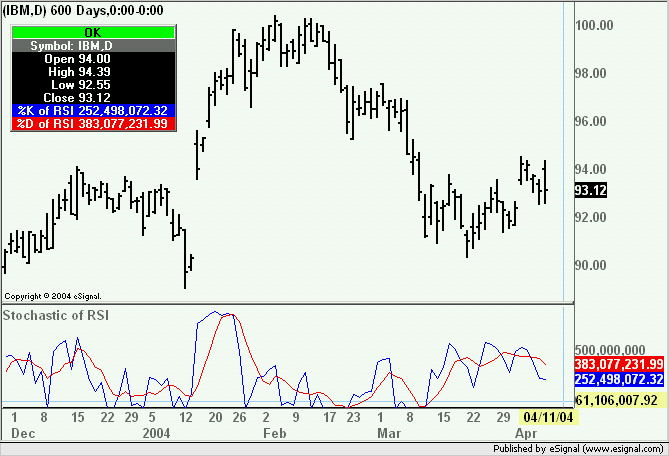
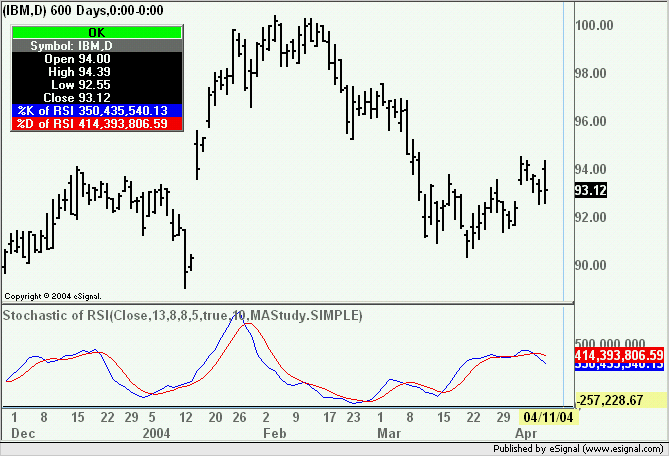
The images below show the plot with %K Smooth toggled on and off.
If you only need the %K or %D plot then you can edit the return in Line 178 of the script and replace it with either return vK; or return vD;
Alex


Attached Files
Comment
-
Alexis:
Thank you for your gracious help. I am not familiar with the StochRSI created by Jason. The StochRSI I requested is as follows:
(RSI(periods)-LLV(RSI(periods),periods))/
(HHV(RSI(periods),periods)-LLV(RSI(periods),periods))
where LLV is the lowest value in the period and the HHV is the highest value in the period
I thought this was a generic formula for StochasticRSI. It appears this is different from the parameters in the indicator you developed. Could you please confirm or revise the indicator to the above?
Again, I truly appreciate any help.
Comment
-
linsar
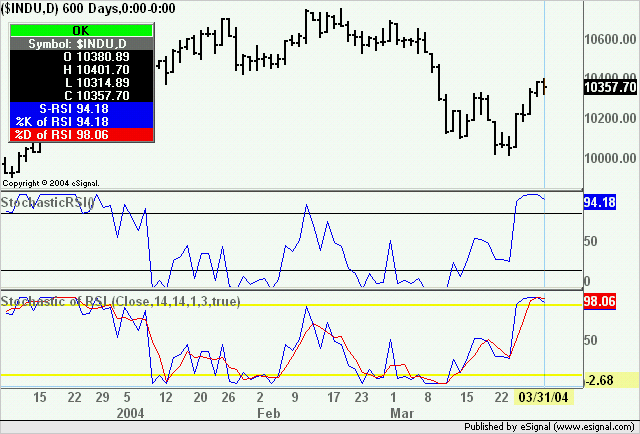
FYI the efs I used is a StochRSI and returns the same plot as the one that is for example provided by eSignal in the Library folder (see image below comparing the two). The advantage the version JasonK coded offers is that it allows for all the parameters to be adjusted and also plots the %D.
Alex

Comment
Comment