I´m new to esignal. Could anyone help me in programming the following:
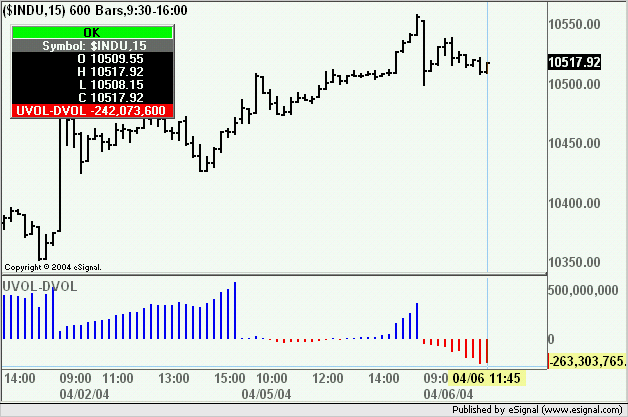
Bar Chart for the NYSE or NASDAQ Up Volume - Down volume with the difference plotted as Blue if it's above zero, Red if it's below.
Thanks.
Rookie
Bar Chart for the NYSE or NASDAQ Up Volume - Down volume with the difference plotted as Blue if it's above zero, Red if it's below.
Thanks.
Rookie

Comment