Announcement

Collapse
No announcement yet.

need help to make a study of a study

Collapse
This topic is closed.
X
X
 
  • Filter
  • Time
  • Show
Clear All
new posts

  • need help to make a study of a study

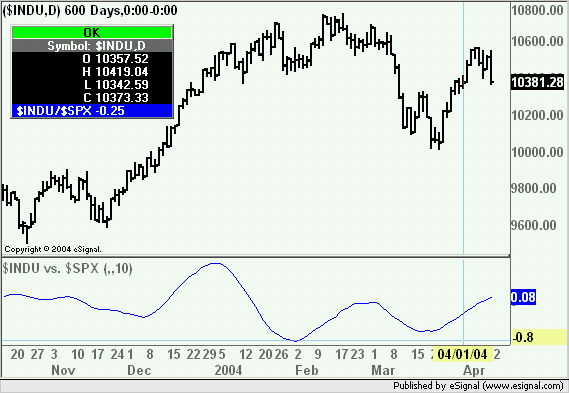
    I am not a programmer, but I have 'cut and pasted' my way around esignal 'efs' -until now that is. I have tried to make a study that finds 'rate of change' of 'relative strength ratio'. The formulas that I am using are 'maofroc' and 'relativestrengthratiowithma(2)'. I put the following into the 'maofroc' formula to provide a data source:
    if (rocPriceSource == null) {
    rocPriceSource = "relativestrengthratiowithma(2)";

    But i get error problems like:
    'Library\13MAof26ROCof RS ratio.efs, line 26:
    ROCStudy parameter 2 invalid

    so do need an easy bit of coding or what?
    thx
    dan miskie
    [email protected]

  • #2
    Dan
    The maofroc.efs is based on a builtin study and as such can only use another builtin study in a "study on study".
    This means that to accomplish what you are trying to do you need to use an ROC study built from scratch.
    In the attached efs I have used the one that is available in the Library subfolder of Formulas and have inserted it in lines 71 through to 91 of the script.
    The attached efs will calculate and plot the ROC of the MA in relativestrengthratiowithma(2).efs. The revisions are commented in the script and also show how to base the ROC on the relativestrength rather than the MA.
    Alex

    Note: At the time of posting the efs has not been tested in "real time" conditions as it cannot be used with Tick Replay

    Attached Files

    Comment


    • #3
      Alex-
      Thankyou very much for the help, I think it works now. (even though I did try to input the 'vValue' of the relative strength ratio formula into the roc formula before, but it didn't work then).
      I need a couple of clarifications. Is 'frPeriod' a data input frame that comes from the Edit Studies option that is right-clicked into from the advanced chart window? In the formula that you setup, if I replace 'vAverage' with 'vValue' where noted, a single roc line is drawn of the relative strength ratio only? And if I put in 'vAverage' to replace 'vValue' where noted, does this construct a single moving average line of the above roc? (which is what it appears to do upon inspection, and is what I am trying to do).
      thx again for your help
      dan

      Comment


      • #4
        Dan

        Is 'frPeriod' a data input frame that comes from the Edit Studies option that is right-clicked into from the advanced chart window?

        frPeriod sets the length of the MA of the relative strength ratio between the symbol in the main window and the one set through Edit Studies.

        In the formula that you setup, if I replace 'vAverage' with 'vValue' where noted, a single roc line is drawn of the relative strength ratio only?

        That is correct.

        And if I put in 'vAverage' to replace 'vValue' where noted, does this construct a single moving average line of the above roc?

        No it computes the ROC of the MA of the relative strength ratio
        Alex

        Comment

        Working...
        X