Announcement

Collapse
No announcement yet.

Data Display in Chart

Collapse
X
 
  • Filter
  • Time
  • Show
Clear All
new posts

  • Data Display in Chart

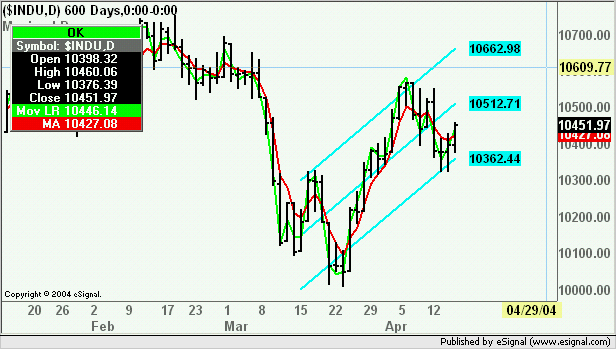
    I am using an efs based on linear regression analysis. Within the efs, calcs are performed and trend bars are displayed on the chart (advanced chart).

    However, I cannot get the current values of the 3 trend bars (identified in the efs as 'Upr' 'Basis' 'Lwr') to display to the right of the chart or in the data (cursor) window.

    I suspect this is an easy fix that is just alluding me.

    Can someone provide some counsel??

    Thanks!!

    Taj
    Attached Files

  • #2
    Taj
    Those values are not returned by the efs and as such will not write to the Y-Axis scale or to the Cursor Window.
    One solution could be to write the end points of the channel on the chart iself (see attached revision of the efs).
    Alex

    Attached Files

    Comment


    • #3
      Thanks, Alex!

      Alex, what you've done and what you displayed below would work just fine...but, using your modified efs, I still can not get the #'s to display in the chart as you have.

      Is there a property of the chart that I need to change that is not readily apparent to me??

      We're headed in the right direction!!

      Thanks for you help!!

      Taj

      Comment


      • #4
        Taj
        Not that I am aware of. I just downloaded the efs again to make sure it was working and it is writing the numbers to the chart just as in the image I posted.
        What version of the software are you running?
        Alex

        Comment


        • #5
          Alexis,
          You beat me to the punch by a few minutes. I had just done the same thing for Taj.

          Taj, you probably just need to scroll your chart to the left a few bars and the numbers will show up. The chart does not automatically move over to show them, and they print to the right of the last bar.

          Bob

          Comment


          • #6
            #'s Exposed!!

            I use 7.6 (build 636A).

            I just did as another poster suggested>>moving the chart over a few clicks<< and the bar values are exposed.

            So, the numbers were there in your revised EFS, Alex.

            Thanks to all!!

            Now (going to the well one more time)...is it possible to have these bar values appear to the right of the vertical grid line (as they do for the other values displayed)?? I'm not looking a gift-horse in the mouth as what you guys have done for me is great. Just curious.

            Thanks much!!

            Be well.

            Taj

            Comment


            • #7
              Taj
              If "to the right of the vertical grid line" you mean where the prices are then that is the Y-Axis scale I was referring to in my prior reply.
              You can force the chart to show the values by increasing the right margin. To do this right click the chart select Properties and insert a higher number in Right Margin Offset
              Alex

              Comment


              • #8
                Taj,
                I believe you need to return the values from main() to display them in that column. This is not currently the method being used to display the values for you. That column can get crowded, so try this method for a few days and see how you like it.

                This is Mel Raiman's indicator which Jason converted for us, but Mel never gave any details on it's use. Can you give us a run down on how Mel meant for it to be used?

                Thanks, Bob

                Comment


                • #9
                  Alex...

                  Thanks...Yes that offset change works fine and does not require the scrolling. Thanks!!

                  Taj

                  Comment


                  • #10
                    Bob...Re: Mel's app/efs

                    Bob, I can not speak to the exact use Mel intended for his app....but I can briefly share how I am using it.

                    I'm a swinger and am using Mel's app to show me when a price (yellow line in app) reversal to get into sync with trend (blue lines in app) is occurring.

                    I'm using the day chart as my driver (but monthly chart must show uptrend for long support or downtrend for short support). You can use most any time interval to suit yor trading tastes.

                    Let's say I want to go long stock X. The price (yellow) is below the lowest blue trend iine. When it 'hooks' and crosses the lower blue trend line, I enter. Exit profit targets are the middle blue line (mean) and the upper blue line. A hook back over and down across either of these upper 2 blue lines signals 'exit now'. If after first cross of lowest blue line, price hooks back over lowest blue line, this is a failed trade and requires exit now...but, since we are looking at an UPtrend set of blue lines, this failed trade exit may in fact not be a loss. If one was working a long trade on a downtrend blue line set, the early exit on a failed trade would likely be a loss. Good risk/reward view.

                    I have 4 charts with diff time intervals: 5/15/30/D. I check monthly chart nightly to ensure trend still intact.

                    In essence, one is looking for extrreme price points and reversals from those points. Very simple and very elegant.

                    I'm sure Mel has other nuances he works with...which I am not knowledgeable in. But this is my simple use of the app. If you run the app (the one I posted...and is available elsewhere on ES; or Alex's modified one), review a bunch of stocks you normally follow to see how things look. A couple right now that are on the verge of showing swing entries are CSCO PMCS...so look at those 2 to get an idea of what I'm talking about on the daily chart.

                    Hope this helps...good luck...and be well!!

                    Taj

                    Comment


                    • #11
                      Taj,
                      Thanks for the info. I'll check it out.

                      Bob

                      Comment

                      Working...
                      X