Announcement

Collapse
No announcement yet.

tick data problem

Collapse
X
 
  • Filter
  • Time
  • Show
Clear All
new posts

  • tick data problem

    I'm having problems with tick data for AX M4-DT

    If I load the tick chart (e.g. 10T) after the market starts, say 8:05am, then the tick chart is populated with previous days ticks and current days ticks, a moving average also works okay.

    If I load the tick chart before the market starts, say 7:55am, then the tick chart is not populated with previous days ticks, current days ticks start normally once the market is open but the moving average won't appear unless I reload eSignal..

    Subsequently this creates efs problems when using something like this before the market opens:

    var tickbars = 20;
    var ticksymbol = getSymbol() + ",10T";
    var tickhistory = getValue("Close", 0, tickbars, ticksymbol);

    any ideas?
    Paul Williams
    Strategy & Applications
    www.futurenets.co.uk

  • #2
    I have no idea as to the solution, but I'm experiencing the same problem with the bundfuture (GB M4-DT).

    Tick charts and Constant Volume charts are empty when opened before the trading session starts. Though normal time interval charts do show data.

    After trading starts, only the current ticks are shown. Reloading the data does not always populate the chart, sometimes I have to do strange things, like changing time templates.

    I, too, would appreciate a solution to this problem.

    Regards

    Bernd Kuerbs

    Comment


    • #3
      Paul, Bernd
      You may want to see this thread for a solution to what seems to be a similar issue
      Alex

      Comment


      • #4
        Thanks Alexis, will test it tomorrow morning.


        regards

        Bernd Kuerbs

        Comment


        • #5
          It does not work: I defined a new time template using a fixed number of days, assigned it to the charts yesterday before closing eSignal, but today in the morning got the same behaviour. eSignal does not update constant volume or tick charts. Only after trading has begun and one bar has been drawn, the changing of time templates will cause eSignal to display all of the data.

          This clearly is a bug.

          Regards

          Bernd Kuerbs

          Comment


          • #6
            unfortunately didn't work for me either
            Paul Williams
            Strategy & Applications
            www.futurenets.co.uk

            Comment


            • #7
              different problem but something wierd is also happening with dax & smi daily

              Paul Williams
              Strategy & Applications
              www.futurenets.co.uk

              Comment


              • #8
                Bernd, Paul
                FWIW I am not seeing this behavior on three separate installs.
                Could you post an image of the Time Template that is assigned to the chart? Maybe that can help shed some light on the issue.
                Alex

                Comment


                • #9
                  Here is a screenshot of the template I used: http://home.t-online.de/home/Bernd.K...%20eSignal.png

                  The option "Auto" does not help, because it will show as "9:00 - 20:00". This time applies to the stock index futures, the bonds trade from 8:00 - 19:00.

                  My time zone is GMT + 1, plus daylight saving time now.

                  Regards

                  Bernd Kuerbs

                  Comment


                  • #10
                    Bernd
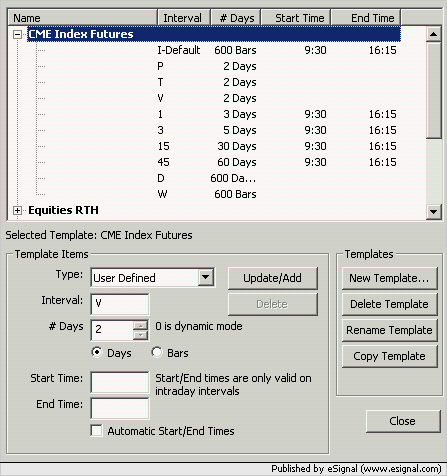
                    Although you do have a Time Template set for 5 days the way it is set up does not control tick based charts (ie T, V, P or S intervals).
                    If you are using Constant Volume bars you need to add a User Defined interval for V (ie Volume bars) with a predefined number of days. If you are using Tick based interval you need to add a user defined T interval also with a specific number of days and so on for all the other tick based intervals (see enclosed image)
                    Once you do the above you should see the issue you are reporting disappear.
                    Note that at this time with Tick based charts (ie T, V, P, S intervals) you cannot set the Start and End times
                    Hope this helps
                    Alex

                    Comment


                    • #11
                      Many Thanks Alexis,

                      I defined the templates as you described. Next test tomorrow morning. Let's hope it will work now.

                      Regards

                      Bernd Kuerbs

                      Comment


                      • #12
                        thanks Alexis, have also set this up and looks good. will test tomorrow.
                        Paul Williams
                        Strategy & Applications
                        www.futurenets.co.uk

                        Comment


                        • #13
                          Hi Alexis,

                          thumbs up, today the charts loaded as they should do. Many thanks for this hint.

                          Now do yourself a favour: include a help file for the Time Template dialogue. The information may be somewhere (buried) in your help files, I could not locate it.

                          To change the Time Template when you change the type of chart isn't an intuitive idea and I wasn't the only one missing this.

                          Have a nice day

                          Bernd Kuerbs

                          Comment


                          • #14
                            everything good my end.

                            one last question, will this "T" time template now make tick data accessible to efs e.g. if I use this in a 5 minute chart

                            var tickbars = 20;
                            var ticksymbol = getSymbol() + ",10T";
                            var tickhistory = getValue("Close", 0, tickbars, ticksymbol);

                            without the actual tick chart
                            Paul Williams
                            Strategy & Applications
                            www.futurenets.co.uk

                            Comment


                            • #15
                              Hi Paul,

                              did you experience any problems at the open of FDAX/ESTX50 trading?

                              eSignal stopped updating the charts at the open: the data manager displayed "Nopswd Nodata" after a few minutes, it recovered from this state.

                              See http://home.t-online.de/home/Bernd.K...-29%200905.png

                              Note the gap between 9:00 and 9:04.

                              It is the second time this week.

                              Have a nice day

                              Bernd Kuerbs

                              Comment

                              Working...
                              X