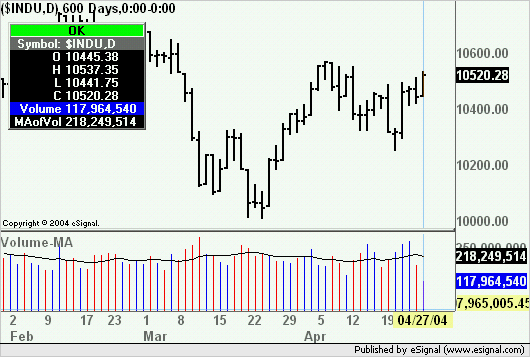
The Volume Moving Average EFS seems to have an anomaly where sometimes the average is displayed higher than the current volume even though the current volume is higher than the average.


the 2 images were taken from 2 different charts using the same VMA.EFS. The 1st chart has the avg vol line drawn above the actual volume and the 2nd has it below (for the last 2 days).
Also, it should be displaying a rounded value of the average ( like 4M or 240K) but it doesn't do that.


the 2 images were taken from 2 different charts using the same VMA.EFS. The 1st chart has the avg vol line drawn above the actual volume and the 2nd has it below (for the last 2 days).
Also, it should be displaying a rounded value of the average ( like 4M or 240K) but it doesn't do that.

Comment