Announcement

Collapse
No announcement yet.

Creating merged studies via EFS

Collapse
X
 
  • Filter
  • Time
  • Show
Clear All
new posts

  • Creating merged studies via EFS

    I have an EFS study with both a MACD and Stochastic in it. I am trying to show both studies in a merged fashion.

    I can do this MANUALLY by adding both studies to the chart, then merging them.

    My problem is:
    Only the last one shows.

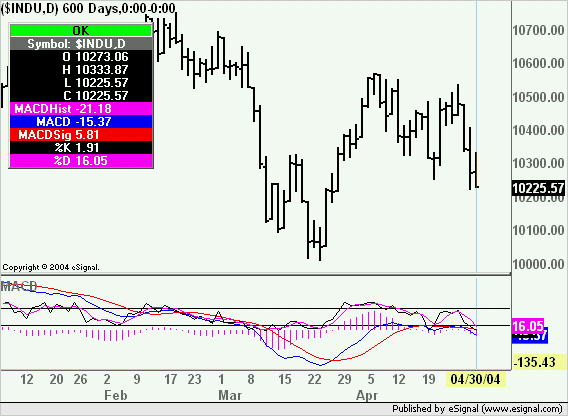
    This shows the MACD only:
    PHP Code:
    return new Array (
      
    vMACD1.getValue(MACDStudy.HIST),
      
    vMACD1.getValue(MACDStudy.MACD),
      
    vMACD1.getValue(MACDStudy.SIGNAL)
      
    //vSto1.getValue(StochStudy.FAST),
      //vSto1.getValue(StochStudy.SLOW)
    ); 
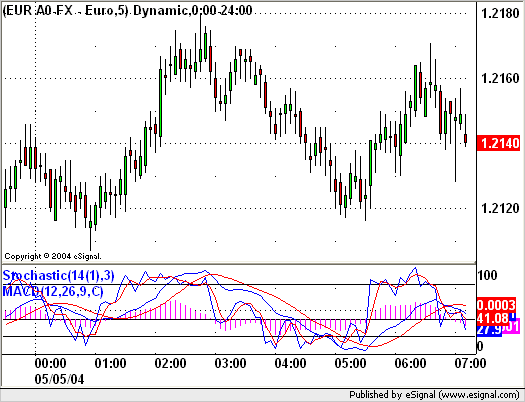
    This shows the Stochastic only:

    PHP Code:
    return new Array (
      
    vMACD1.getValue(MACDStudy.HIST),
      
    vMACD1.getValue(MACDStudy.MACD),
      
    vMACD1.getValue(MACDStudy.SIGNAL),
      
    vSto1.getValue(StochStudy.FAST),
      
    vSto1.getValue(StochStudy.SLOW)
    ); 
    hmmm.

    There must be a trick to it?

    Thanks,
    Ted.

    -function THEO( Get'nFancyWithThemTharIndicatorThingys )

  • #2
    Ted
    The attached efs plots both the MACD and the Stochastic in the same window.
    All parameters for both studies can be modified through Edit Studies
    Alex

    Attached Files

    Comment


    • #3
      Doesn't Work

      Unfortunately, that doesn't work.

      I downloaded the script and tested it...

      While it DOES work with standard stock data:
      '$INDU'
      It DOESN'T work with FOREX data:
      'EUR A0-FX'.

      My original script and the one you provided both act the same. While, both indicators work with stock data, both indicators operate as stated below with FOREX data.
      (At least I figured that much out)

      Thanks,
      Ted.

      -function THEO( ItMustBeSomethingInTheWater );

      Comment


      • #4
        I can duplicate that problem when using that EFS. I am however able to overlay the two studies by using the Shift-Drag method described here.

        Regards,
        Jay F.
        Product Manager
        _____________________________________
        Have a suggestion to improve our products?
        Click Support --> Request a Feature in eSignal 11

        Comment


        • #5
          Ted
          An alternative could be to use either a multiplier on the MACD to be used with certain symbols (sort of what eSignal does with the Price Oscillator) or apply a weight to the symbol iself
          Just an idea
          Alex

          Comment


          • #6
            JayF,
            Thanks, that does work (see first post). Unfortunately, it doesn't meet my needs. I'm developing trading systems, so manually adding an indicator to see what the system is set to do introduces the requirement to keep the two in-sync (and additional room for error). It also increases CPU overhead beyond what it takes to calculate and view the initial indicator. I'm really gun-shy about that since I just got winsig.exe to keep from spiking CPU to 100% after 12 hours of continuous use. (I plan to run multiple trading systems per eSignal login, so I'm *REALLY* scrutinizing overhead.)

            Alexis,
            Thanks. I haven't got a clue about what you just said, but I'll look into it starting with the Price Oscillator.

            I'm at the point of diminishing returns on this. I realize that regardless of the indicators (studies) used, I am only going to properly view either Price Studies OR Non-Price Studies out of one EFS at any given time. Also, if I'm *REALLY* serious about the overhead thing I probably shouldn't be outputting anything to view in the first place.

            Thanks,
            Ted.

            -function THEO( BreakOutTheBooks! );

            Comment

            Working...
            X