Announcement

Collapse
No announcement yet.

Avoid spikes in volume

Collapse
X
 
  • Filter
  • Time
  • Show
Clear All
new posts

  • Avoid spikes in volume

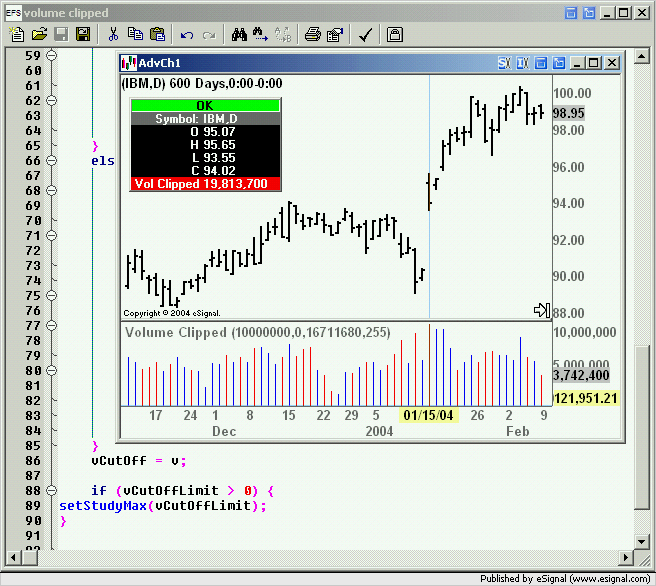
    When you use volume a lot to try to read the markets, single spikes can be annoying, because they compress the volume chart and make the rest of the chart unreadable.

    Resizing the volume in the volume pane by dragging the scale does not work; you can resize volume, but not move it up and down.

    To cut off spikes in volume, I have written a little efs study. Since I'm new to efs, I would like any comments.

    Just use this study instead of the volume display. The limit may be entered by using the "Edit Study" dialogue. I have not included any parameters for the color display. This would be a nice extension.

    Regards

    Bernd Kuerbs

    PHP Code:
    /*****************************************************************
    Based upon "Tick Extremes.efs" from eSignal
    *****************************************************************/

    /*** To avoid volume spikes distorting the volume chart, the display of volume values larger than the limit
            will be cut off.
            
        The user may enter the limit via the "Edit Studies" dialogue;
        The bars are colored based upon the price chart, not by comparing to the volume of the prvious bar.

    ***/

    function preMain() {
        
    setStudyTitle(" Volume Cut Off ");
        
    setCursorLabelName("Vol Cut Off"0);
        
    setPlotType(PLOTTYPE_HISTOGRAM0);
        
    setHistogramBase(0);
        
    setDefaultBarThickness(10);
        
    setDefaultBarFgColor(Color.yellow0);
    }

    var 
    vColorBse Color.yellow;
    var 
    vColorUp vColorBse;
    var 
    vColorDn Color.cyan;

    function 
    main(vCutOffLimit) {
     
        
        var 
    close();
        var 
    open();
        var 
    volume();
        var 
    vColor;
        var 
    vCutOff
        
        if (
    == null || == null || == null ) return;

        
    vColor vColorBse;
        if (
    >= o) {
            
    vColor vColorUp;
        }
        else {
            
    vColor vColorDn;
        }

        
    vCutOff v;
        
        if (
    vCutOffLimit != null) {
            
    vCutOff Math.min(v,vCutOffLimit);
        }

        
    setBarFgColor(vColor0);
        
        return (
    vCutOff);


  • #2
    Changed it a bit, so colors and the way up and down bars are determined can be set via the "Edit Studies" dialogue.

    Regards

    Bernd Kuerbs
    Attached Files

    Comment


    • #3
      Bernd
      You may also want to try replacing

      if (vCutOffLimit > 0) {
      vCutOff = Math.min(v,vCutOffLimit);
      }


      with

      if (vCutOffLimit > 0) {
      setStudyMax(vCutOffLimit);
      }


      This way even when clipping the volume plot you can still read in the Cursor Window the actual volume of a clipped bar instead of the CutOffLimit.
      Alex

      Comment


      • #4
        Hi Alexis,

        many thanks for your suggestion.

        Unfortunately, I do not get it to work for me. I tried the change, and when I enter a limit then, the study disappears. Reloading, removing and loading anew do not help.

        As far as I understood setStuyMax will work only in the preMain part?

        It would be really helpful, when this change worked.

        Regards

        Bernd Kuerbs

        Comment


        • #5
          Bernd
          I am aware that the help files indicate it works only in preMain but I have been using both setStudyMax and setStudyMin in main in several efs without any problems.
          Anyhow in the attached image you can see it is working at my end. The volume chart is clipped at 10,000,000 yet the label in the Cursor Window is reading 19,813,700.
          Alex

          Comment


          • #6
            Hi Alexis,

            this is really good news; because when exporting data, the clipped value will be exported. Your way, the real volume will remain unchanged for this purpose.

            And now I need some coffee, to find out why it did not work for me.

            Many Thanks

            Bernd Kuerbs

            Comment


            • #7
              Yep, the coffee infusion was of great help: here is the latest version.

              Have a nice day.

              Bernd Kuerbs
              Attached Files

              Comment


              • #8
                Wow -- this is excellent -- thanks!

                The volume charts a great idea. But, what I like more is the concept. It drives me nuts when CCI/TRIN/etc spikes to 300+ and compresses my entire display so the next hour until that deviant bar scrolls off, I'm looking @ teeny little movements.

                Nice -- thanks.

                -c

                Comment


                • #9
                  Excellent!! I trade ES emini using price & vol and vol spikes are really annoying. Well done!! Thanks for sharing.

                  Comment


                  • #10
                    Great work Bernd

                    I can see what to change to get my preferred colors. To get ColorScheme 2 do I change the '0' in line 32 to '2'?

                    And where do I input the volume cutoff value? Is it a fixed value (which I would need to change for each stock, or timeframe)? Or could it be made to cut off at values in excess of say 3 times the simple average of the last 20 volume bars? Does a clipped bar change color (say from normal green to dark green if up, and from red to dark red if down, so that I readily know its a clipped bar?

                    Last question - would this affect other volume related indicators such as OBV?

                    Regards
                    shaeffer

                    Comment


                    • #11
                      Originally posted by shaeffer
                      Great work Bernd

                      I can see what to change to get my preferred colors. To get ColorScheme 2 do I change the '0' in line 32 to '2'?

                      And where do I input the volume cutoff value? Is it a fixed value (which I would need to change for each stock, or timeframe)? Or could it be made to cut off at values in excess of say 3 times the simple average of the last 20 volume bars? Does a clipped bar change color (say from normal green to dark green if up, and from red to dark red if down, so that I readily know its a clipped bar?

                      Last question - would this affect other volume related indicators such as OBV?

                      Regards
                      shaeffer
                      Right-click in the chart, select "Edit Studies", then select "Volume clipped" and then you can set the volume cut off limit, set the colors for up- and down bars and select the logic for the coloring of the up and down bars.

                      There is no need to change the efs code.

                      The limit is a fixed value of your choice and you would have to set it individually for each stock.

                      This could be a lot of work, if you follow a lot of stocks. No concern for futures traders, who just watch some futures.

                      A clipped bar does not change its color, you will recognize it, when it reaches up to the upper band of the volume study pane. See the example.

                      It will not effect any other indicators, because the volume value is not changed.

                      I had thought of building some automatism, but since I do not need it, I didn't. It will eat some CPU cycles, especially when you watch a lot of stocks.

                      If people want it, I could try to include it.

                      regards

                      Bernd Kuerbs

                      Comment


                      • #12
                        Hi Bernd,

                        Your instructions worked. But I messed with the efs anyway to get my preferred colors (lines 36 and 40) and preferred ColorScheme (2), (line 32) as the default.

                        But I could not change the line thickness in the Study Properties box and still keep two colors. Is it possible? I tried changing line 21, but that didn't seem to do anything.

                        I saw that setting the cutoff value also fixes the upper limit of the volume window. So I understand now how a volume spike can be 'recognized' - that works well.

                        In a 5 min chart, I clipped the big morning volume spike in AFFX - it worked great. But then I changed to EBAY and every volume bar was clipped. So some way to change the clip value based on the average volume per symbol per time frame would be very useful for anyone changing ticker symbols often.

                        The coffee worked for you last time. I could send you out some in an IV bag for the weekend, if that would help you create a variable volume clip parameter :-)

                        Regards
                        shaeffer

                        Comment


                        • #13
                          Originally posted by shaeffer
                          .......

                          But I could not change the line thickness in the Study Properties box and still keep two colors. Is it possible? I tried changing line 21, but that didn't seem to do anything.

                          You have to change the first number in setDefaultBarThickness. Just tried it, it works. If you want to make this changeable per the "Edit Studies" dialogue then the thickness must be added as parameter.

                          A nice little exercise for you.....


                          I saw that setting the cutoff value also fixes the upper limit of the volume window. So I understand now how a volume spike can be 'recognized' - that works well.

                          .......
                          The coffee worked for you last time. I could send you out some in an IV bag for the weekend, if that would help you create a variable volume clip parameter :-)

                          Regards
                          shaeffer
                          I'm not bribable....

                          I see the problem for stock traders. I'll look into it, but do not expect it this weekend.

                          Have a nice weekend

                          Bernd Kuerbs

                          Comment


                          • #14
                            I wrote a new version of the study, one which tries to do the clipping (and "unclipping") automatically.

                            It seems to be ok for the time frames I'm using, but I use only a few tickers.

                            There are some parameters involved, most of them I left inside the efs, that is they cannot be changed by the "Edit Study" dialogue. I think, when these parameters have to be changed often, the manual version will be preferable.

                            Regards

                            Bernd Kuerbs
                            Attached Files

                            Comment

                            Working...
                            X