Announcement

Collapse
No announcement yet.

eSignal Support or someone on this forum

Collapse
X
 
  • Filter
  • Time
  • Show
Clear All
new posts

  • eSignal Support or someone on this forum

    Does EFS allow you write codes to chart data coming from a specific exchange or combination of exchanges only?

    As an example, if I want to chart MSFT trades ocurring only at a certain exchage (say, BSE only) or combination of exchanges (say, BSE & PSE only), can I write an EFS to do this? Additionally I may want to chart this in any time interval.

    Normally what we can chart is all trades of MSFT (ie, at all the exchanges).

    If this is possible please tell me where to find more information on how to write this EFS?

    Thanks
    Sajal

  • #2
    I honestly don't know..

    I'm sure someone from esignal will reply to answer your question...

    I wish I could help, but I have not a clue...

    B
    Brad Matheny
    eSignal Solution Provider since 2000

    Comment


    • #3
      did you try plotting nyse:ibm?

      Comment


      • #4
        As far as I can tell, no it's not possible on NASD stocks. If you are interested in NYSE stocks, then you could use a regional symbol in your EFS and that should work (i.e. IBM=N gives NYSE only trade records, IBM=B gives only Boston trades, etc).

        This FAQ will provide additional information on using regional symbols.

        If I find a way you can in fact do this for NASD stocks, I'll be sure to post here again.

        Thanks.

        Comment


        • #5
          I think the real question here ends up being, can I specify an exchange for a symbol in advance charts. If the answer is yes to that, then the answer should be, yes to this.

          I don't happen to know if you can do that however. Some looking at the symbol format page in help, and some playing really doesn't answer that question.

          Maybe someone else knows...Alex? Alex?

          Garth
          Garth

          Comment


          • #6
            Would be really great if it can be done. Lot better than watching a fast scrolling t&s data window. Although they have a search & filter dialog for the advanced t&s, it really isn't effective. It does not truely filter out what you do not want to see. Plus the bid and size volume appears in the same column. Has no calculation feature which I think could have been easily added. It has been in place for quite some time and I still see in eSignal features list touted as "only the beginning of amazing t&s info"...or something like that , but nothing so far!

            But yes if this data can be charted by exchanges, would be a great tool to monitor buy/sell activity in specific exchanges.

            ps, I think they want ActiveX revenue from such needs...is ActiveX is capable of charting activity by exchange???

            Ho hum, Good Luck!
            Fred

            Comment


            • #7
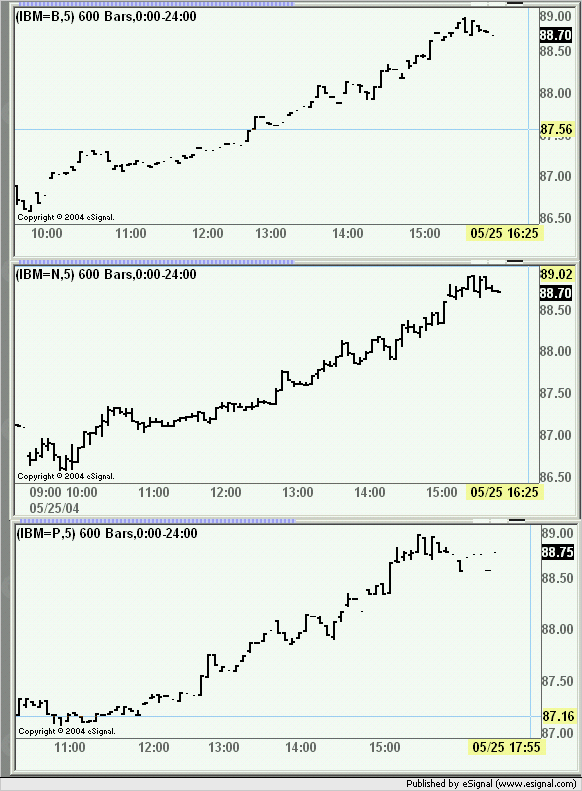
              You can chart stocks by exchange although not the NASD stocks as Scott has already said (see IBM charts below for BSE, NYSE and PSE)
              You can also apply the exchange filters in T&S or T&Q either for Quotes or Trades
              Alex

              Comment


              • #8
                Thanks to all that responded so promptly.
                Is there a way to chart the data that we get in the t&s window? We have the bid/ask/traded exchange information here and the only modification that would be needed is to just provide the bid size and ask size in their own columns.
                Sajal

                Comment


                • #9
                  Sajal
                  You can access the Bid, Ask and corresponding sizes through efs.
                  The commands are getMostRecentBid(), getMostRecentAsk(), getMostRecentBidSize() and getMostRecentAskSize().
                  Alex

                  Comment


                  • #10
                    Originally posted by ScottJ
                    As far as I can tell, no it's not possible on NASD stocks. If you are interested in NYSE stocks, then you could use a regional symbol in your EFS and that should work (i.e. IBM=N gives NYSE only trade records, IBM=B gives only Boston trades, etc).

                    This FAQ will provide additional information on using regional symbols.

                    If I find a way you can in fact do this for NASD stocks, I'll be sure to post here again.

                    Thanks.
                    Scott or Anyone,

                    Can you at least let me know for sure if you provide t&s data (and particularly, the name of the exchange) as part of your data feed? If yes then I'll look for 3rd party charting to capture, store and manipulate. It'll be helpful if you can provide me with a list of all the data elements that you provide as datafeed to your customers (or point me to a page that provides this list).

                    Also let me know if ActiveX can help me in what I am trying to do, then maybe I can add that service.

                    Thanks.
                    Sajal

                    Comment


                    • #11
                      There are few answers to your question(s):

                      Yes, you can chart regional equities, but only on an intra-day basis. (IBM=P, 5). The list of regional exchanges and their symbols is located [http://www.esignalcentral.com/suppor...bol_format.asp]here[/URL].

                      The Desktop API (ActiveX) provides Time & Sales data and the the TimeSalesData data structure lists the exchange the trade occurred. The Developer Reference and sample applications are located here. You can sign in and review the documentation, but will not be able to use the API until it is purchased.

                      I believe that answers your question.

                      Robi

                      Comment

                      Working...
                      X