Announcement

Collapse
No announcement yet.

Pairs Trades Problem,

Collapse
X
 
  • Filter
  • Time
  • Show
Clear All
new posts

  • Pairs Trades Problem,

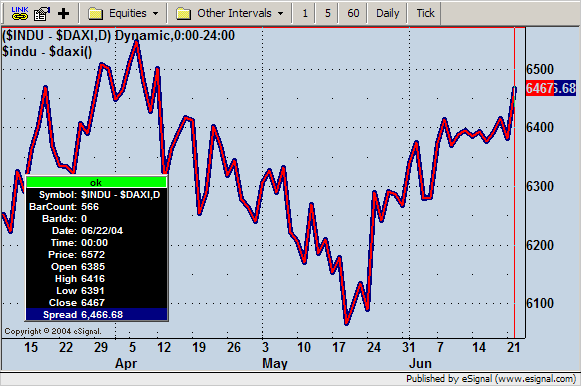
    when using advanced charts to chart the difference between two indexes say the dow & dax you would use the following code $indu - $daxi , now on the daily bars this uses the close of the dow & the dax on say 18/06/2004,

    is there any way of plotting this using the previous nights close on the dow & todays close on the dax, i have tried the following but it does not work,

    $indu(-1) - $daxi

    anyone got any ideas,
  • #2
    Hello shogun,

    You would need an EFS to do this. Try the following on a daily chart. It plots the difference of close(-1, "$indu") - close(0, "$daxi").

    PHP Code:
    function preMain() {
        
    setStudyTitle("$indu(-1) - $daxi");
        
    setCursorLabelName("spread");
    }


    function 
    main() {
        var 
    nIndu1 close(-1"$indu");
        if (
    nIndu1 == null) return;
        
        var 
    nDax close(0"$daxi");

        return (
    nIndu1 nDax);

    Jason K.
    Project Manager
    eSignal - an Interactive Data company

    EFS KnowledgeBase
    JavaScript for EFS Video Series
    EFS Beginner Tutorial Series
    EFS Glossary
    Custom EFS Development Policy

    New User Orientation

    Comment


    • #3
      thanks jason ,

      the efs is giving one problem where the dates run out of sync if one of the two markets is closed and the other open due to a public holiday, is there any way of keeping the two in sync after just such a event

      i added the following to find the problem,

      i altered the bar offset to help find the problem ,the following is what i get in the formula output window,

      dax date = 21
      indu date = 21
      dax date = 18
      indu date = 18
      dax date = 17
      indu date = 17
      dax date = 16
      indu date = 16
      dax date = 15
      indu date = 15
      dax date = 14
      indu date = 14
      dax date = 11 // here the go out of sync, due to us close
      indu date = 10
      dax date = 10
      indu date = 9
      dax date = 9
      indu date =8


      function preMain() {
      setPriceStudy(true);
      setStudyTitle("$indu(-1) - $daxi");
      setCursorLabelName("spread");
      setComputeOnClose();

      }


      function main() {

      var vDate = getDay(0,"$indu")
      debugPrintln(vDate," = ","indu date")
      var vDate1 = getDay(-1,"$daxi")
      debugPrintln(vDate1," = ","dax date")


      var nIndu1 = close(0,"$indu");
      if (nIndu1 == null) return;

      var nDax = close(-1,"$daxi");

      debugPrintln ((nIndu1 - nDax),"Diff"," = ",nDax,"dax"," - ",nIndu1,"indu");


      return (nIndu1 - nDax);
      }
      Last edited by shogun; 06-22-2004, 05:07 AM.

      Comment


      • #4
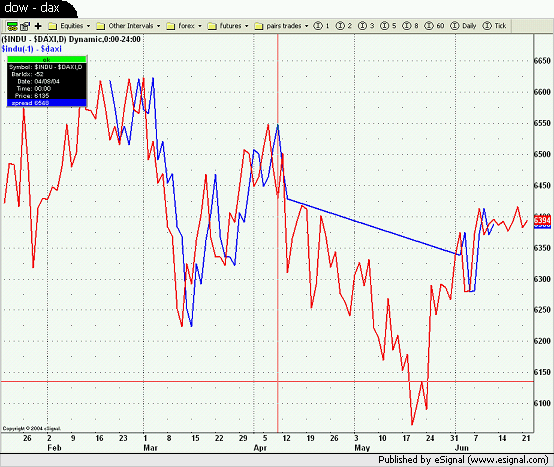
        ok been giving this a bit more thought and i have added the following lines after the vDate variables and the following chart shows the result, the red line is the $indu - $daxi on the advanced chart, the red line is the $indu - $daxi on the .efs. note that between 13/04/2004 & 02/06/2004 the blue line is straight as the two symbol dates are out of sync, anyone got any ideas as to how i can solve the problem.

        lines added to efs

        if(vDate>vDate1) return;
        if(vDate<vDate1) return;


        Comment


        • #5
          Hello Shogun,

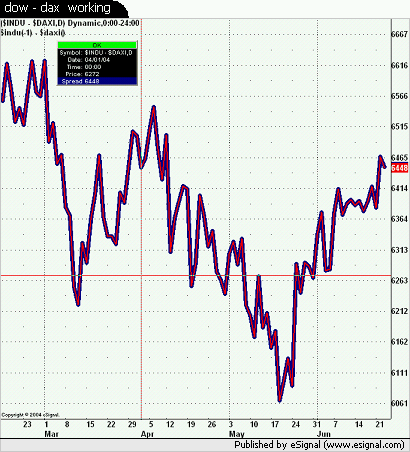
          I made the false assumption there was a 1:1 relationship in the daily interval between the two indexes. Silly me. When requesting price data from external symbols through getValue() or close(), for example, there will be a synchronization issue if they don't have the same exact timeline for the period specified by the time template. This you already know. Well, in this case, on the daily interval, it is possible to sync the $indu and $daxi. The red line in the chart below is the spread, $indu - $daxi from the chart. The navy blue line is the calc from the efs. I set up the formula with an Offset parameter that will be applied to $indu in the calc. So if you want to get $indu(-1) - $daxi, enter -1 for Offset in Edit Studies. Take a look at the code below and let me know if you have any questions.


          shogun_Indu_Daxi.efs

          PHP Code:
          /*****************************************************************
          Provided By : eSignal. (c) Copyright 2004
          *****************************************************************/

          function preMain() {
              
          //setPriceStudy(true);
              
          setStudyTitle("$indu(-1) - $daxi");
              
          setCursorLabelName("Spread");
              
          setDefaultBarThickness(50);
              
          setDefaultBarFgColor(Color.navy);
          }

          var 
          aIndu null;
          var 
          aDax null;

          var 
          nIndu1 null;
          var 
          nDax null;
          var 
          nOffsetIndu null;
          var 
          nOffsetDax null;
          var 
          nBarCntr 0;


          function 
          main(Offset) {
              if (!
          isDaily()) return;
              var 
          nState getBarState();
              var 
          nIndex getCurrentBarIndex();
              
              if (
          Offset == null) {
                  
          Offset 0;
              } else {
                  
          Offset Math.abs(Offset);
              }
              
              if (
          close(0,"$daxi") == null || close(0,"$indu") == null) return;
              
              if (
          aIndu == null || aDax == null) {
                  
          aIndu = new Array(Math.max(5Offset));
                  
          aDax = new Array(Math.max(5Offset));
              }
              
              if (
          nState == BARSTATE_NEWBAR) {
                  if (
          nDax != null) {
                      
          aDax.pop();
                      
          aDax.unshift(nDax);
                  }
                  if (
          nIndu1 != null) {
                      
          aIndu.pop();
                      
          aIndu.unshift(nIndu1);
                  }

                  var 
          vDay getValue("rawtime");
                  
                  if (
          nOffsetIndu == null) {
                      
          nOffsetIndu = (getNumBars() - getNumBars("$indu"));
                  } else if (
          vDate != vDay) {
                      var 
          vDate getValue("rawtime"nOffsetIndu,"$indu");
                      if(
          vDate vDay) {
                          do {
                              
          nOffsetIndu--; 
                              
          vDate getValue("rawtime"nOffsetIndu"$indu");
                          } while (
          vDate vDay);
                      } else if (
          vDate vDay) {
                          do {
                              
          nOffsetIndu++; 
                              
          vDate getValue("rawtime"nOffsetIndu"$indu");
                          } while (
          vDate vDay);
                      }
                  }
                  
                  if (
          nOffsetDax == null) {
                      
          nOffsetDax = (getNumBars() - getNumBars("$daxi"));
                  } else if (
          vDate1 != vDay) {
                      var 
          vDate1 getValue("rawtime"nOffsetDax,"$daxi");
                      if(
          vDate1 vDay) {
                          do {
                              
          nOffsetDax--; 
                              
          vDate1 getValue("rawtime"nOffsetDax"$daxi");
                          } while (
          vDate1 vDay);
                      } else if (
          vDate1 vDay) {
                          do {
                              
          nOffsetDax++; 
                              
          vDate1 getValue("rawtime"nOffsetDax"$daxi");
                          } while (
          vDate1 vDay);
                      }
                  }
              }
              
              
          nDax close(nOffsetDax,"$daxi");
              if (
          nDax == null) return;
              
          nIndu1 close(nOffsetIndu,"$indu");
              if (
          nIndu1 == null) return;

              
          aDax[0] = nDax;
              
          aIndu[0] = nIndu1;
              
              
              if (
          aIndu[Offset] == null || aDax[0] == null) return;
              var 
          nSpread aIndu[Offset] - aDax[0];
              if (
          nSpread == null || nSpread == 0) return;

              if (
          nState == BARSTATE_NEWBARnBarCntr++;
              if (
          nBarCntr <= Math.max(5Offset)) return;
              
              return 
          nSpread;

          Jason K.
          Project Manager
          eSignal - an Interactive Data company

          EFS KnowledgeBase
          JavaScript for EFS Video Series
          EFS Beginner Tutorial Series
          EFS Glossary
          Custom EFS Development Policy

          New User Orientation

          Comment


          • #6
            jason, excellent i would not have got that in a million years,

            i am getting one side effect and i am not sure if it is the efs or my computer as you seem to have run it ok on your computer, if i load the efs on a chart of the $indu it works fine but if i try and load it onto a chart of $indu - $daxi it freezes esignal and sends the cpu to 100%, i tried adding

            if(getCurrentBarIndex()<-100)
            return;

            at the beginning of function main to see if that would help but i still get the same problem, any ideas, ?

            i am on esignal version 7.6(build634)

            Comment


            • #7
              Hello Shogun,

              By the nature of what we're doing in the code, it's a very inefficient routine. Coupled with the spread symbol in the chart makes it even slower. There's a couple things you can do that will help. Open up two other daily charts for $indu and $daxi. Also apply a time template that limits the number of days to display. Start with something like 90 days. Apply the same template to the other 2 daily charts. The image I posted was in dynamic mode. I had about 500+ days loaded.

              The check for bar index of -100 is a good idea. That should help also.
              Jason K.
              Project Manager
              eSignal - an Interactive Data company

              EFS KnowledgeBase
              JavaScript for EFS Video Series
              EFS Beginner Tutorial Series
              EFS Glossary
              Custom EFS Development Policy

              New User Orientation

              Comment


              • #8
                jason , you have cracked it, i opened two other charts one of the $indu & the other $daxi and it works perfect,

                thanks,

                Comment


                • #9
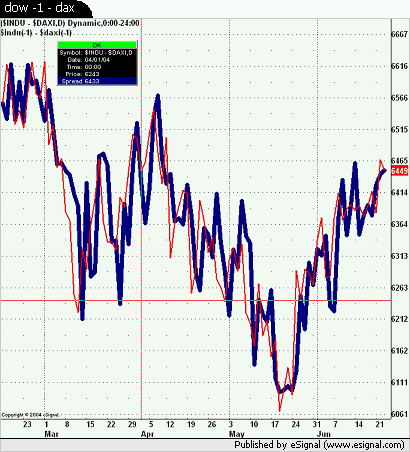
                  and this chart shows the offset at -1,


                  Comment

                  Working...
                  X