Angelo
La formula non plotta il MACD in un sottografico ma disegna soltanto le frecce nel grafico dei prezzi.
Vedi il commento in preMain al comando setPriceStudy(true)
Alex
Angelo
Che versione di eSignal stai usando? Nota che quella formula e' scritta con EFS2 e quindi richiede la 7.9. Inoltre e' necessario che tu abbia il file amStudies.efsLib nella cartella FunctionLibrary (sotto eSignal).
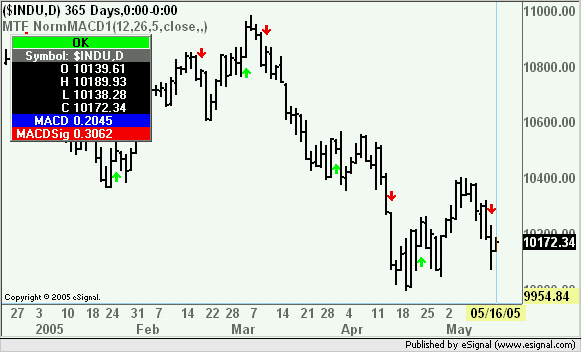
Se stai usando la versione 7.9 e hai il file amStudies.efsLib allora e' possibile che tu non abbia copiato per intero la formula. In basso puoi vedere come mi appare nel grafico
Alex
sto usando la 7.9
effettivamente non avevo immesso l'efs nella function library
..ma evidentemente c'è qualcosa di errato nella formula, perchè continua a non comparire
ecco la formula che ho copiato
var fpArray = new Array();
var amLib = addLibrary("amStudies.efsLib");
function preMain() {
setPriceStudy(true);//uncomment this line if drawing arrows in price pane
//see also return statement
setStudyTitle("MTF NormMACD1");
setCursorLabelName("MACD",0);
setCursorLabelName("MACDSig",1);
setDefaultBarFgColor(Color.blue,0);
setDefaultBarFgColor(Color.red,1);
setPlotType(PLOTTYPE_LINE,0);
setPlotType(PLOTTYPE_LINE,1);
setDefaultBarThickness(1,0);
setDefaultBarThickness(1,1);
setDefaultBarThickness(1,2);
askForInput();
var x=0;
fpArray[x] = new FunctionParameter("Fast", FunctionParameter.NUMBER);
with(fpArray[x++]){
setLowerLimit(1);
setDefault(12);
}
fpArray[x] = new FunctionParameter("Slow", FunctionParameter.NUMBER);
with(fpArray[x++]){
setLowerLimit(1);
setDefault(26);
}
fpArray[x] = new FunctionParameter("Smoothing", FunctionParameter.NUMBER);
with(fpArray[x++]){
setLowerLimit(1);
setDefault(5);
}
fpArray[x] = new FunctionParameter("Source", FunctionParameter.STRING);
with(fpArray[x++]){
addOption("open");
addOption("high");
addOption("low");
addOption("close");
setDefault("close");
}
fpArray[x] = new FunctionParameter("Symbol", FunctionParameter.STRING);
with(fpArray[x++]){
setDefault("");
}
fpArray[x] = new FunctionParameter("Interval", FunctionParameter.NUMBER);
with(fpArray[x++]){
setDefault("");
}
}
var bInit = false;
var vSymbol = null;
var xMACD = null;
var xSig = null;
function main(Fast,Slow,Smoothing,Source,Symbol,Interval){
if(xMACD.getValue(0) < xSig.getValue(0) && xMACD.getValue(-1) > xSig.getValue(-1)){//modified by ACM
drawTextRelative(0,AboveBar1,"ê",Color.red,null,Te xt.PRESET|Text.CENTER|Text.BOLD,"Wingdings",10,"Dn "+ getCurrentBarCount());
}else{
removeText("Dn"+getCurrentBarCount());
}
//NOTE: arrows cannot be drawn in price chart if efs is non price study
//return new Array (getSeries(xMACD),getSeries(xSig));
return new Array (getSeries(xMACD).toFixed(4),getSeries(xSig).toFix ed(4));//uncomment this line and comment out line above if efs is setPriceStudy(true),
//note, in return line above, toFixed converts to text value which only returns values to cursor window, not to chart
}
//you need to pass the parameters to the function
function ratio(fast,slow,source){
var sht = wma(fast,source);
var lng = wma(slow,source);
var ratio = (Math.min(sht,lng)/Math.max(sht,lng));
var ret = sht>lng?((2-ratio)-1)*100 : ((ratio)-1)*100;
Angelo
Ho provato la formula ed e' corretta (l'immagine nella mia risposta precedente lo dimostra).
L'efs che hai copiato va salvato come efs in Formulas o una delle sottocartelle di Formulas. Per funzionare pero necessita che nella cartella FunctionLibrary ci sia il file amStudies.efsLib
Alex
Angelo
Dovrebbe salvarlo come *.efsLib. Se fai un click di destra sul file e selezioni Properties cosa scrive nel Type of file?
Se riporta EFS allora prova a riscaricare e quando ti chiede di dargil un nome aggiungi .efsLib come suffisso
Alex
Angelo
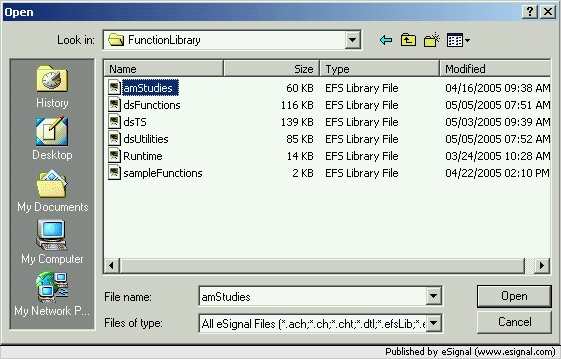
Lo stai salvando come *.efsLib anche se tu non vedi il suffisso (perche hai settato Windows per non mostrarti I suffissi dei tipi di files conosciuti)
Se noti il Tipo di file e' EFS Library File e non EFS File Type come sarebbe invece se fosse un efs.
Prova a visualizzare la finestra come nell'immagine che segue
Alex
 Tweet
Tweet


Comment