Announcement

Collapse
No announcement yet.

Where is $RUT data?

Collapse
X
 
  • Filter
  • Time
  • Show
Clear All
new posts

  • Where is $RUT data?

    Hi -

    I use AdGET end-of-day and for the life of me can't determine how to create a chart for the Russel 2000. The symbol should be $RUT according to the eSignal symbol list, but I can't locate this symbol in the issue list. Can anyone help?

    -Baffled
    Fritz

  • #2
    Fritz
    I don't think it is included in the eSignal Wizard indices. Regardless if you are in online mode you should be able to create a chart. Try clicking File-> New Chart then in the Symbol field of the Issues window type $RUT and click Load.
    Alex

    Comment


    • #3
      Got it - thanks!
      Fritz

      Comment


      • #4
        Fritz
        My pleasure
        Alex

        Comment


        • #5
          How then to import a list of index symbols?

          Because the Wizard doesn't support but relatively few indices, how then can I import a long list of index symbols and create a portfolio of them? I have a list of 148 Dow Jones index symbols that I want to import and turn into a portfolio. After the portfolio is created, I want to use the autopage function to create a set of charts (with each chart having monthly, weekly, daily and hourly charts) based on the index symbols in the new portfolio. Because the Wizard doesn't support any of these index symbols, I could do this manually, but that would involve manually creating and saving 148 different charts, each with four separate subcharts (monthly, weekly, daily and hourly subcharts) = 4*148 = 592 entries. This of course begs the question of why the Wizard doesn't support the index symbols of one of the most widely-used industry indexing systems (the basic Dow-Jones industry system used by many entities - e.g. marketwatch.com). Am I missing something?
          Fritz

          Comment


          • #6
            Fritz

            Because the Wizard doesn't support but relatively few indices, how then can I import a long list of index symbols and create a portfolio of them?
            At this time I don't think that is possible.

            I could do this manually, but that would involve manually creating and saving 148 different charts, each with four separate subcharts (monthly, weekly, daily and hourly subcharts) = 4*148 = 592 entries.
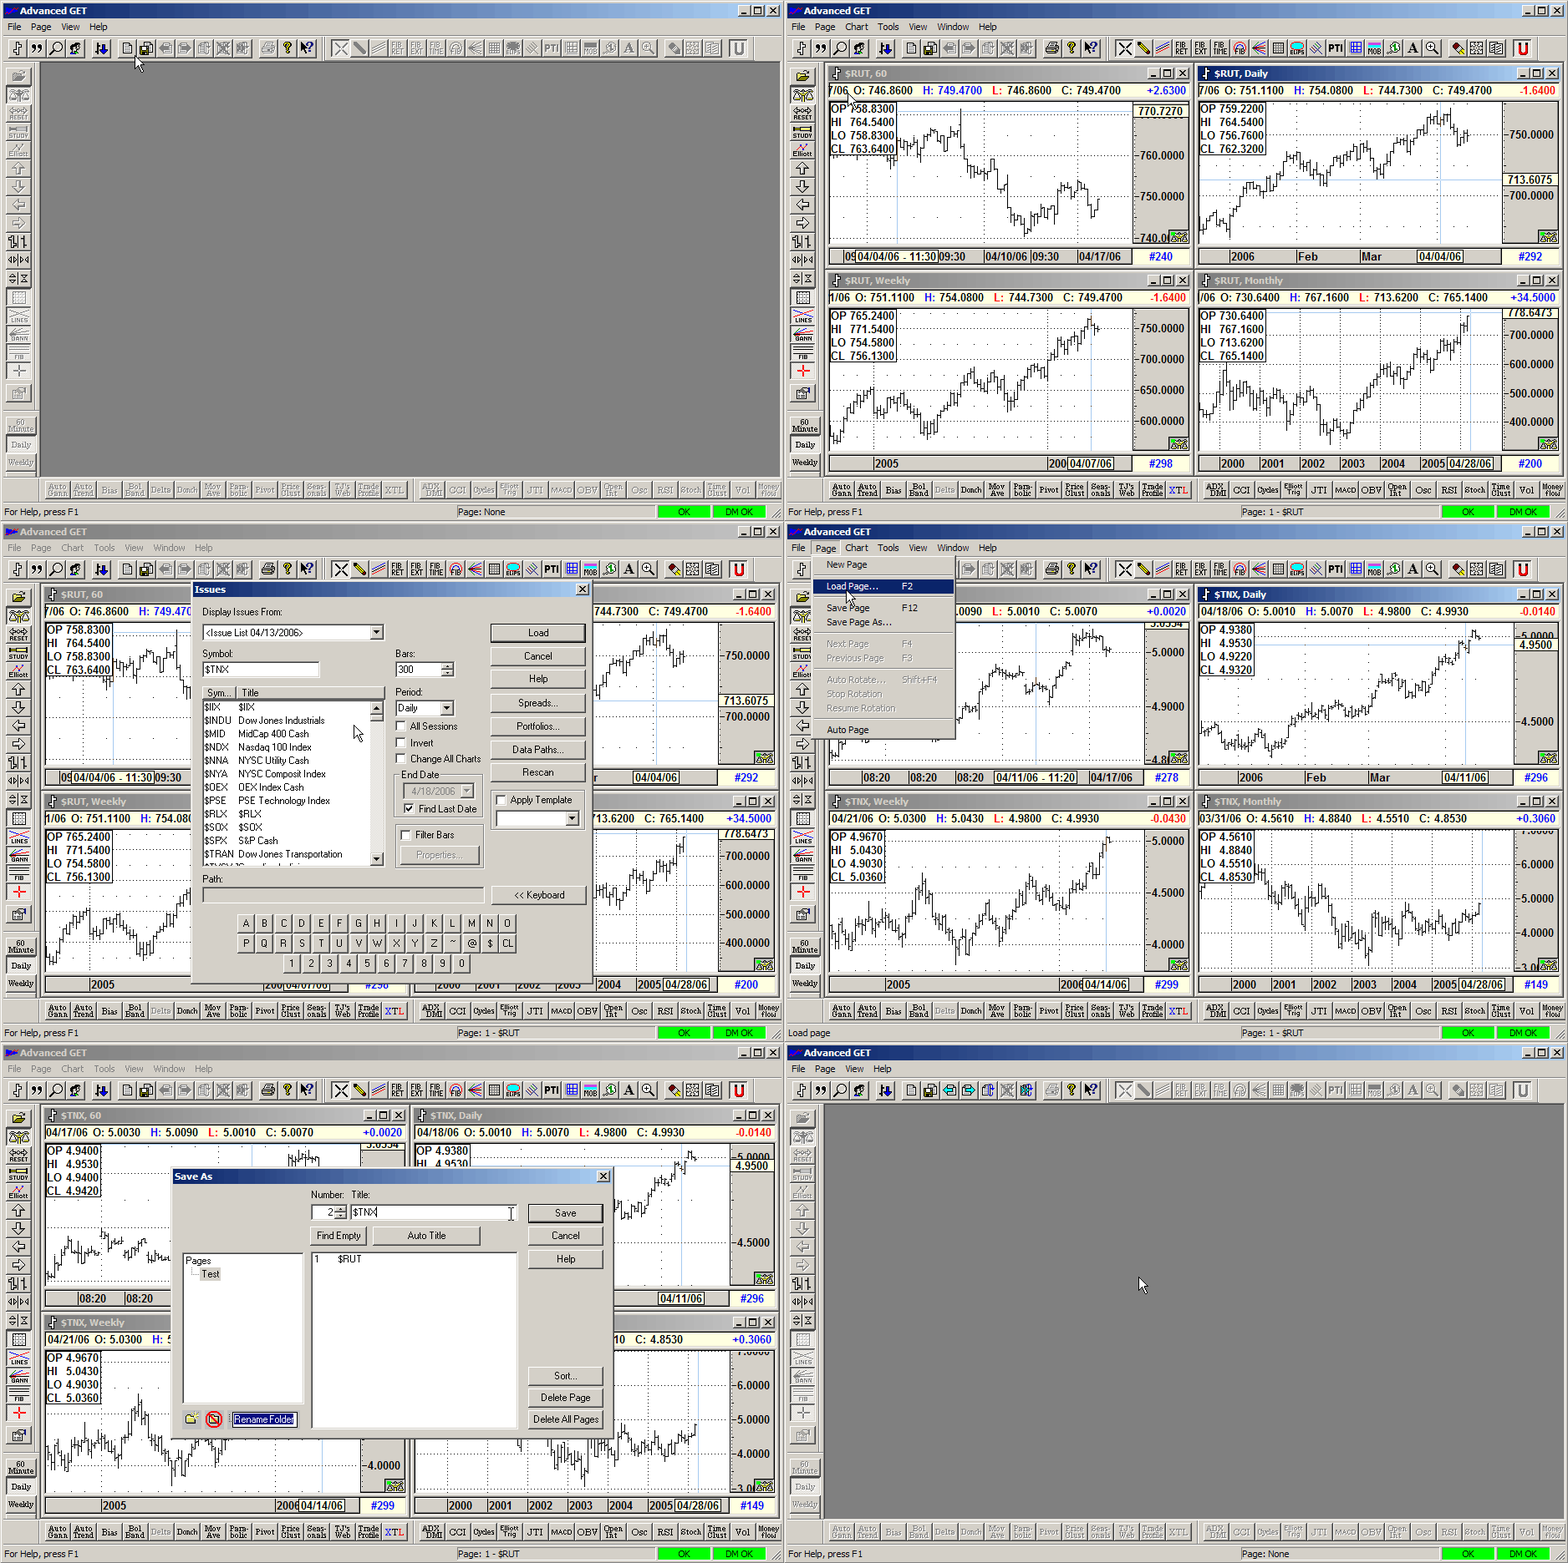
            While you woulld still have to enter the 148 symbols you would not necesarily have to create 592 entries. If you first create and save a Page that contains all four charts (Hourly, Daily, Weekly and Monthly) for one of those symbols you can then apply a new symbol simultaneously to all the charts in that Page by checking the Change All Charts box (see enclosed animated image)
            Alex

            Comment


            • #7
              But "Change all Charts" is accessible as far as I can tell only through File-New Chart, and when I bring in a new symbol in this manner it requires me to select a "period", and that results in a duplicate chart (e.g. two daily charts, along with the desired monthly, weekly and hourly charts) being created.
              Fritz

              Comment


              • #8
                Fritz
                Change All Charts is available either by clicking the Issues icon (as I show in the animated image) or by selecting Chart-> Issue from the main menu
                Alex

                Comment


                • #9
                  Yes, I know how to access the "Change all Charts" feature (p.s. the animated window doesn't show any animation for me - I use Firefox). The problem is not how to access the feature; I know how to do that. The problem is that this feature adds in a new chart, so that for example, if I have a page with four charts - monthly, weekly, daily and hourly charts - then using "Change all Charts", with its built-in requirement to select a "Period", results in the addition of a new chart based on the "Period" selected. If I select "Daily" in the "Period" menu (and I have to select a "Period"), then I wind up with a page that has a monthly chart, a weekly chart, TWO daily charts, and an hourly chart - 5 charts in total, two of which are duplicates. I'd like to not have duplicate charts in my pages. The problem is not with accessing the "Change all Charts" feature, but rather with the fact that it creates a duplicate chart.
                  Fritz

                  Comment


                  • #10
                    Fritz
                    As far as I can see at my end using both version 7.8 and 9.1 a new chart is added only if you select File-> New Chart and then check Change All Charts.
                    If instead you select Chart-> Issue then change the symbol, check Change All Charts and click Load no new chart is created and all the existing ones simply change symbol.
                    If you have an image viewer that allows you to view animated gif files then you can download the image here. The file is called ani-advget eod online symbols.gif
                    Alex

                    Comment


                    • #11
                      I finally got it. Thanks for your patience.
                      Fritz

                      Comment


                      • #12
                        Fritz
                        You are most welcome
                        Alex

                        Comment


                        • #13
                          Change All Charts

                          Hello Everyone

                          Please let me clarify, to change the symbol in existing charts, RIGHT click in one of the chart windows that is currently opened. Then LEFT click on ISSUES, enter the symbol you wish to view. Place a check in the box labled "Change All Charts" and final press the LOAD button.
                          Gary Welte
                          Advanced GET User

                          Comment

                          Working...
                          X