Announcement

Collapse
No announcement yet.

Formula Wizard MACD histogram

Collapse
X
 
  • Filter
  • Time
  • Show
Clear All
new posts

  • Formula Wizard MACD histogram

    Hi-

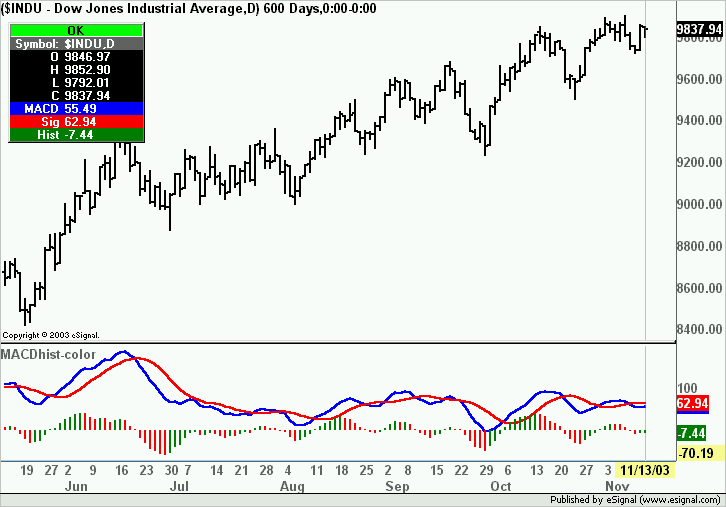
    I am trying to create a Macd histogram that will show the color red
    when down from previous day and show green when up from previous day. Any help on this would be extremely appreciated.

    take care,
    Jon Bailey

  • #2
    Jon
    The attached efs should do what you asked and was created using only the Formula Wizard.
    Alex

    Attached Files

    Comment


    • #3
      Alex-

      Thank you very much!

      a couple questions for you-

      1.) Can I change the macd settings?
      2.) How do I download this into my Advanced Charting?

      Take care-
      Jon

      Comment


      • #4
        Jon
        1) You can change the settings by opening the formula with the Formula Wizard and editing the values in the study configuration.
        2) Click on the attachment then select Save to disk and save it to any of the subfolders of the Formulas folder in the eSignal directory.
        To apply it to a chart right click the chart, select Formulas and navigate to the subfolder in which you saved the efs.
        Alex

        Comment

        Working...
        X