Announcement

Collapse
No announcement yet.

Identifying Start of W3

Collapse
X
 
  • Filter
  • Time
  • Show
Clear All
new posts

  • Identifying Start of W3

    The Trading Strategies paper on trading the 5th wave is very clear. Is there a paper on finding the start of wave 3 apart from an XTL continuation?

    Wave 3 is the longest and potentially the most profitable so an early identification method is critical. Can AGET do this?

  • #2
    Identifying Wave Three

    The best tool in Advanced GET to identify the early stages
    of an Elliott Wave Three is the XTL study.

    Please refer to the manual or the seminar videos under the XTL
    breakout rules. I can sum it up real quick. For example when an
    Elliott Wave Three rally is in progress, the XTL will generate a
    first Blue Bar. This first Blue Bar is called the breakout bar.

    Take the range of this breakout bar (High - Low) and add 50%
    of the this range to the high of the breakout bar. Prices have to
    continue to trade higher and cross through this filtered range to
    trigger an XTL breakout BUY. When used in conjucntion with
    the software generated Elliott Wave counts, this technique
    will get you into a majority of Wave Three swings.

    The first break out bar of the XTL can be searched for in the end
    of Day version. For real time, this can be searched through the
    Advanced GET scanner on various time frames from a 15 min
    chart to a monthly chart.

    I hope this gives you a starting point on this issue.

    Thanks
    Tom Joseph
    eSignal- Advanced GET

    Comment


    • #3
      Thanks. That's very helpful.

      One question, for very short term emini trading, would you use the normal XTL setting of 35 or something shorter?

      Comment


      • #4
        Short-term SP Mini

        When trading the SP Minis on a 3 minute timeframe, what oscillator settings work best? Also, should one use the short-term or normal ellipse? How about settings for XTL on this timeframe; the default or something different?

        I guess if one is familiar with Type 1 and XTL trades, what are the best settings for a short-term SP Mini trading program?

        Comment


        • #5
          XTL Settings

          I have always been a strong advocate of using one setting for
          all markets and all time frames. This avoids the tendency to
          curve fit. The XTL setting of 35 is the recommended setting
          and should be used for short term trading on the emini as well.

          In research that I have done, I find the normal setting of 35 is
          the best. A setting of 21 gives you earlier entires in some cases, but you also will introduce several wrong signals.

          As as trader, I would take the accuracy over a slightly earlier
          entry. Having said this, my suggestion is to try the 21 period
          XTL in the eSignal Training Mode and decide for yourself which
          setting is better for your trading style.

          Tom Joseph
          eSignal-Advanced GET

          Comment


          • #6
            XTL Trades

            Using the standard XTL methodology, includiing regression channel exits:

            Period: 1/1/02 - currrent
            Tradable: SPX

            XTL = 35

            Trades: 6
            Wins: 2
            Net SPX Points: +80

            XTL =21

            Trades = 9
            Wins = 5
            Net SPX Points: +133

            My Comment: I just did this quick test to illustrate the differences in the two settings for the past year. Other years could vary considerably. I did extensive testing of the XTL indicator when it was first offered circa 1996 or so. My testing results are not readily available to me (in a box in the attic) but I am as an objective a mechanical trader as I can be and I do not use XTL other then to make my charts a bit more colorful. My main GET squeeze remains the "Type #1" trade after all these years, although I find the Ellipse and MOB wonderful confirmation tools that the counter-trend "correction" may be over. BTW, those are not such bad results for the XTL, but mostly due to each settng catching a huge +100 point move mid-year. You might conclude the a disciplined XTL trader will never miss a huge move. It's the choppiness in between that wears thin.

            A

            Comment


            • #7
              ap305,

              Six or Nine trades over a 14-month period is hardly enough opportunities to evaluate the merits of a strategy. And, while you did tell us the number of points accumulated using each setting - we don't know the points risked per trade, time frame you used to measure (am guessing a daily chart), trade management techniques - did you "stop and reverse"? or exit at targets?

              In order to calculate the expectency per dollar risked we'd need to know those things - in order to judge whether or not the settings and the time frame combination have the makings to be a good system.

              eblaster

              Comment


              • #8
                XTL Trades

                ebalster,

                I agree with observations, but for a quick "look-see" and about fifteen minutes of work, I thought it was at least worth posting. Everything was EOD, daily bars, Tom's 50% of first XTL bar-entry and the software's suggesting of using regression channels for exits. Risk is the high/low of the first red or blue XTL bar, as per original instructions. As I said, I have a much more extensive statistical analysis archived away and based on those results (probably at least five years of back-testing) I don't trade the XTL and it's probably because the results are similar to my previously posted 14 month quickie. I'd have to pull it all out to tell you exactly why it didn't measure up at that time, but that is not on my "to do " list anytime soon. Just take my two cents worth of observation for what it's worth......two cents.

                A

                Comment


                • #9
                  ap305,

                  Ahem, it's "eblaster" with the "l" before the "a", heh.

                  Point taken, you don't trade the XTL as a "stand alone" system. Nor do I suspect the creator of AGET intended it to be used in a vacuum, else why would the other indicators be necessary.

                  One comment from your first post though, "those are not such bad results for the XTL, but mostly due to each settng catching a huge +100 point move mid-year" discounts the fact that each setting caught the move that XTL is designed to catch (unless I am completely misinterpreting the function of XTL) so in that context the indicator has done as advertised.

                  Your two-cents are appreciated. I would love to hear what Tom or Alexis think.

                  Comment


                  • #10
                    eblaster,


                    Yes, the indicator did as it was supposed to do during a 400 point S&P drop mid-year 2002. But, an EOD daily bar application of the "Type 1" strategy caught about 200+ points of that decline in two excellent trades during the same period, although second trade had only a PTI of 17. Even ignoring that second trade the first "Type 1" trade won 136 points, certainly as good a trade as the XTL methodology.

                    This has been my experience with AGET since acquiring it in the summer of 1994. The "Type 1" trades in and of themselves work as good and better then anything else in the AGET arsenal. Is it me, or AGET?

                    My guess: a combination thereof.

                    A

                    Comment


                    • #11
                      Re: Reply to post 'Identifying Start of W3'

                      eblaster

                      Before either Tom, myself or anyone else for that matter, replies it
                      might be worthwhile to briefly explain the XTL method so that those not
                      familiar with Advanced GET may appreciate what is being talked about.

                      XTL, which stands for eXpert Trend Locator is a study which differentiates
                      directional swings from market noise.
                      The study paints the bars in black when it identifies random swings, paints
                      the bars in blue or red respectively in swings that have a strong upwards or
                      downwards directional component.
                      The first colored blue or red bar represents the "breakout bar" and sets the
                      entry levels and stops for the trade. The entry is at 50% of the height of
                      the breakout bar measured from its high in an uptrend or from its low in a
                      downtrend.
                      The stop is set at the low of the breakout bar in an uptrend or at the high
                      in a downtrend. A variant of the stop sees it placed at the opposing 50% of
                      the height of the bar (which is why in the enclosed charts I plot both
                      the original stop values in red and the variants in grey).
                      The study does not generate exit signals. However Advanced GET do have a
                      suggested rule for "minimum" profit, the statistical merits of which are
                      extensively covered in their videos and in the seminars they conduct
                      throughout the country (both strongly recommended BTW).


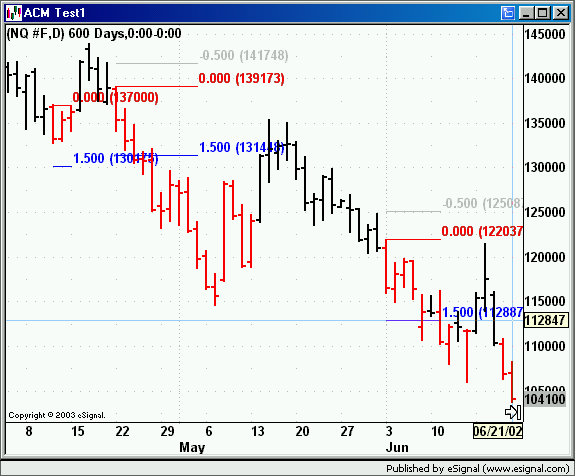
                      In the first image above (daily chart for NQ #F) we can see a number of Sell
                      signals generated by the XTL study. The first one results in no trade as the
                      stop being hit prior to the entry and color change nulls the signal.
                      The second breakout bar instead results in a trade with an entry of 1314 on a
                      stop of 1391 while the third signal is an entry at 1128 with 1220 stop.


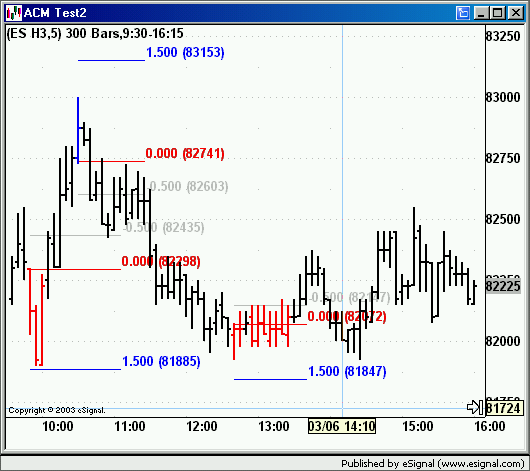
                      The second image (15 minute chart of ES H3) instead shows a market in a
                      series of random swings with some breakout signals being generated on both
                      sides but no trades as the market did not hit any of the suggested entry
                      levels.


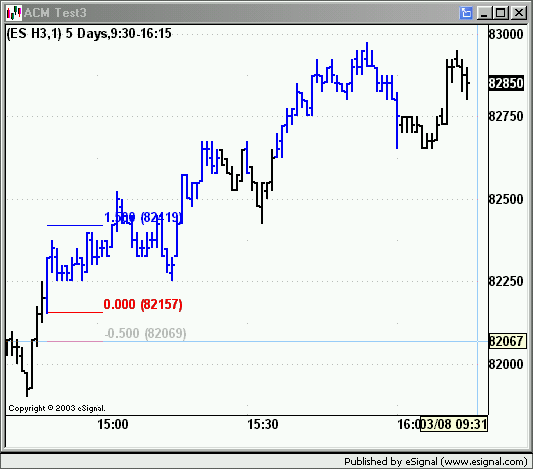
                      The last image (1 minute chart of ES H3) shows instead a breakout
                      signal to the long side followed by a trade entry at just above 824 with a
                      stop of 821.50.

                      This is the XTL study at its very basic. More on the subject will very
                      likely come out as this thread evolves

                      Alex
                      Last edited by ACM; 03-09-2003, 03:09 PM.

                      Comment


                      • #12
                        Alex,

                        In your SPY example the second trade would not have been initiated had one followed the rules in the built-in help for the AG software. The help specifies that the entry bar needs to be the same color as the break-out bar. In your example, the entry bar is black instead of red.

                        Comment


                        • #13
                          geronimo
                          Thank you for noticing that. Keep in mind though that I personally consider that to still be a valid signal
                          However since the object of the message was to show the fundamentals of the XTL study I have changed the image and revised the text.
                          Alex
                          Last edited by ACM; 03-09-2003, 12:37 PM.

                          Comment


                          • #14
                            thanks alexis

                            I appreciate the thorough explanation. I am curious what exit strategy you recommend.

                            It appears that one could could test a sample of several hundred trades using the backtesting feature built into eSignal to determine the expectancy of such a method; and determine what is the "best" multiple of risk one should seek for profit taking.

                            eb

                            Comment


                            • #15
                              Exits

                              From what I have tested during the last 30 hours since Tom Joseph's post, EXITS (which for me have always been more problematic than entries) need to be related to structure. What I am now testing in real time trading is to use some confluence of MOB and elipse in multi time frames - good ol' support and resistance but using GET techniques.

                              I have not been able to benefit from TJ's Web or Gann as there are too many choices. I am a firm believer in KISS and have found that too many choices gives you a greater opportunity of picking the wrong one. Also, by fewer choices, you can validate the methodology in a more objective way.

                              TomB

                              Comment

                              Working...
                              X