 Tweet
Tweet
Hello,
I am a new user to A-GET and have an issue with the MOB placement. I wonder if anyone could point me in the right direction...
I have attached an image of my AGET chart of the SPI (Australian Share Price Index traded through the SFE) and on it you can see the wave formation and regression channels, currently stalking a breakout from wave four.
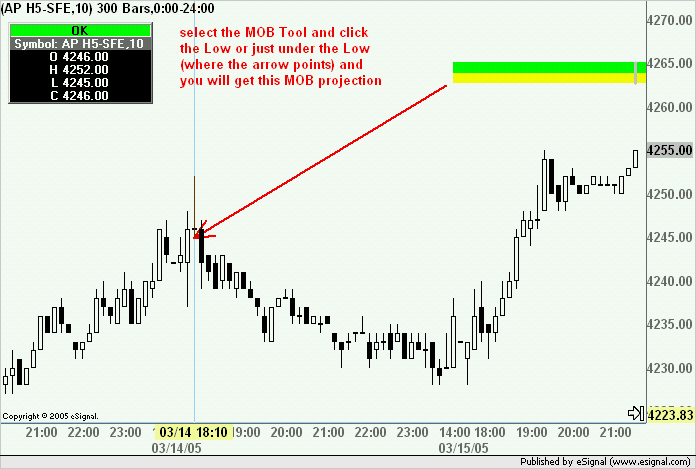
However, when clicking on the wave-3 bar with my MOB tool (as I believe is the correct procedure), it places the MOB below the current price action (and has no info on it).
Does this mean it doesn't have a price objective or something else....
Thanks in advance,
Rene'.
I am a new user to A-GET and have an issue with the MOB placement. I wonder if anyone could point me in the right direction...
I have attached an image of my AGET chart of the SPI (Australian Share Price Index traded through the SFE) and on it you can see the wave formation and regression channels, currently stalking a breakout from wave four.
However, when clicking on the wave-3 bar with my MOB tool (as I believe is the correct procedure), it places the MOB below the current price action (and has no info on it).
Does this mean it doesn't have a price objective or something else....
Thanks in advance,
Rene'.
Attached Files
Comment