 Tweet
Tweet
I have an idea and I think it would work but I can't seem to figure it out.
I use elliott waves all the time and what i would like to do is to use a 5 min chart but somehow show the 1 min line chart on top of the 5 min, so I could see the subwaves. I count them and get tired of looking back and forth from screen to screen.
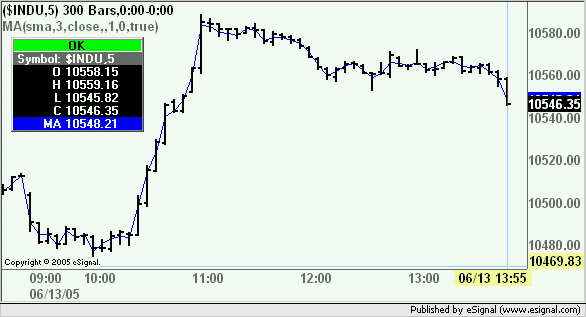
I don't know anyway to do that, but what I thought now that 7.9 is out is to take a very fast moving average of say the one min chart and then put it on top of the 5 min chart, then I would see a very close variable of the one min chart on top of the 5 min chart but for some reason I have not been able to make this work, any help would be appreciated.
Mark
I use elliott waves all the time and what i would like to do is to use a 5 min chart but somehow show the 1 min line chart on top of the 5 min, so I could see the subwaves. I count them and get tired of looking back and forth from screen to screen.
I don't know anyway to do that, but what I thought now that 7.9 is out is to take a very fast moving average of say the one min chart and then put it on top of the 5 min chart, then I would see a very close variable of the one min chart on top of the 5 min chart but for some reason I have not been able to make this work, any help would be appreciated.
Mark
Comment