 Tweet
Tweet
I am fairly new to AGET as well as EFS. I would like to add a 4 period SMA signal line to the 7,17 Oscillator. Can anyone help with this? Thanx
-
-
Tradeoholic
Although it can be done with an EFS you don't necessarily need one to do what you want. You can use the MACD study and set it to 7,17,4. That will return the MACD line which is the 7,17 oscillator and the Signal line which is the 4 period MA of the MACD
Alex -
Oscillator Signal Line
Thank you for the reply. First I must apologize for a typo. I meant the 5,17 GET Oscillator. Tom Joseph had said that the Oscillator is based on simple moving averages and not exponential, which I believe the MACD is based on. I have them next to each other on a chart and they are not even close to each other. On the chart I have selected the Simple Moving Average option for the MACD signal line's but as you can see, the histograms differ greatly. The signal line I had in mind is a single line that follows the histogram. When price pulls below or breaks out above, it becomes a great additional visual confirmation. I have it on another program but did not know how to add it using EFS. Perhaps this may help better describe what I was looking for. Thanx for the help.Attached FilesComment
-
-
Tradeoholic
the Oscillator is based on simple moving averages and not exponential, which I believe the MACD is based on. I have them next to each other on a chart and they are not even close to each other
That depends on how you set up the MACD study. In the following image you can see the 5-17 Get Oscillator compared to a 5-17-1 MACD showing identical values
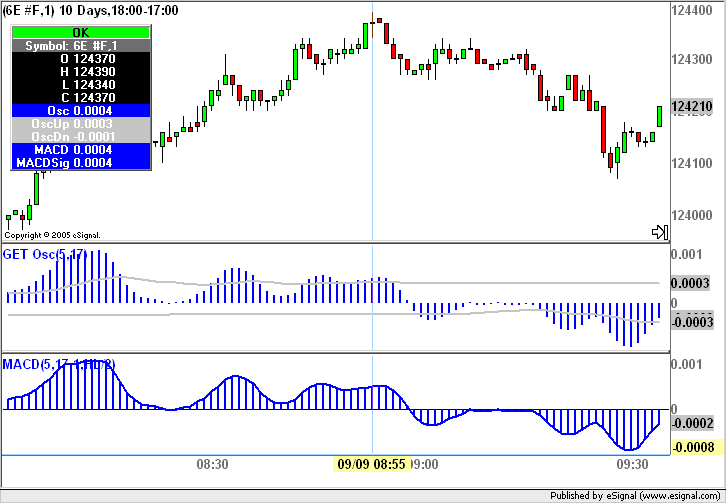
Here is the setup of the MACD so that you can replicate it.

Note that you must uncheck the Histogram in the MACD study because that is not the histogram of the oscillator (ie the difference between the two averages that compose the MACD line) but the histogram of the difference between the MACD and the Signal line. Also note that you must select (H+L)/2 as the Source
In the following image instead you can see the same MACD but with Signal Smoothing set to 4. The Signal line is now plotting a 4 period Simple MA of the Oscillator which is what you want.
Alex

Comment
-
Oscillator Signal Line
Alexis,
Thank you very much. I not only got it, but I learned something new about the MACD today. Thanx again!Comment
-
Tradeoholic
Glad to have been of help and you are most welcome
AlexComment
Comment