Announcement

Collapse
No announcement yet.

Follow Up from last weeks Fabrizio JNS incorrect symbol (technical vs fundamental)

Collapse
X
 
  • Filter
  • Time
  • Show
Clear All
new posts

  • Follow Up from last weeks Fabrizio JNS incorrect symbol (technical vs fundamental)

    Last week my good friend from Italy, Fabrizio, posted a tread suggesting Jones Apparel (JNY) had good fundamental information and suggested we look at the JNS chart.

    I analyzed JNS to see if I could help, but before posting, I double checked the stock symbol. (Being dyslexic and prone to error, out of habit I double or triple check everything.) I did not post JNS after confirming it was NOT Jones Apparel (JNY) but rather another stock. Since I was leaving for vacation I could not follow up, until now... and now it seems like that thread has since been removed. I still want to follow up.

    My primary purpose in posting this follow up on JNS is to suggest, while the fundamental information my friend provided on Jones Apparel [JNY] can be important, it was his JNS stock symbol and its technical picture that caught my eye even more.

    Not to open up a Pandora's Box on what is more important, fundamental or technicals? From my observations over the years, fundamental knowledge can be helpful, but as a technician: tell me when the next earnings report or critical information is being released? That is my fundamental information focus. To avoid surprises this kind of information is extremely important to me.

    JNS is Janus Capital Group. If you look at the current daily chart technicals there are reasons to grow excited. The chart work [below] shows JNS daily as a Wave 4 pullback, a 90% 5/35 Elliott Oscillator pullback holding, a lower MOB and a blue W4 Channel support holding, a blue XTL continuing, a PTI greater than 35 suggesting normal profit-taking and increasing odds of at least one more rally, and the minimum 25% retracement holding. Under an aggressive Type 1 Buy premise, this setup is attractive for aggressive traders.

    While I know my friend made a mistake with his stock symbol, I also want to encourage him.... keep on with your analysis, as you have always done good things from what I have seen. And, I would never have looked at JNS if you had not mentioned it.

    If I can get some time before the July 4th holiday weekend, I will try to also follow up with a Jones Apparel (JNY) chart too, to see if I can help with that one too. http://share.esignal.com/groupconten...er=&groupid=20

    Best wishes, your buddy from Ohio, Marc
    Attached Files
    Last edited by MR; 07-02-2003, 12:52 PM.
    Marc

  • #2
    follow up on JNY

    I promised a followup on Jones Apparel (JNY). Fabrizio... no matter what the fundamentals suggest, when I look at the monthly, weekly, then daily JNY charts with an Advanced GET prospective I continue to still see strong contradictions. Maybe it is just my conservative nature, but this one I am willing to stand aside just a little bit longer until I see a better risk/reward ratio. The technicals are improving, just not enough yet for me to go counter to many of the AGET methodologies or techniques. If JNY trades above 32 or below 27.75 in a few weeks, please remind me to return and review JNY once again. -marc
    Attached Files
    Last edited by MR; 07-03-2003, 10:32 AM.
    Marc

    Comment


    • #3
      .Marc

      I'm monitoring too. Thanks for your consideration. I do really appreciate it.
      As a matter of fact the situation is confused..... and you said the rightest thing : stay on the window and looks what is happening.

      Please, through MSCANNER I've spotted in end March a nice Stock "FLIR" , had really good performance . I'd like your point of view at THIS point. Will You?

      Thanks again.

      Cordially

      Fabrizio
      Last edited by fabrizio; 07-04-2003, 02:39 AM.
      Fabrizio L. Jorio Fili

      Comment


      • #4
        Fabrizio,

        I did a chart for you but cannot post it here because it says the
        size is too large. Go to the Advanced GET User Group @ File Sharing
        and hopefully the chart work will be displayed.

        It is only a 'Quick Look' chartwork I did for you on FLIR.

        They still have atttractive qualities. It is a stock I also have been
        monitoring. I cannot comment specific at this time, but at
        least I could give you a sample of what I am watching.

        Take care, and have a great weekend. - marc
        Last edited by MR; 07-03-2003, 04:25 PM.
        Marc

        Comment


        • #5
          WHO IS IN CONTROL

          Marc

          I appreciate your post : as a part of your group since the very beginning you knew that I would haven't miss it.

          I rise an "accademic" point: Mr. Tom Joseph - and yourself too- put a great emphasis on the " who is in Control". Who is behind this trend and when this or that group of guys loose the control, via the Oscillator interpretation .

          It is a Basic, I know, but don't you think that often many of us do forget to wonder "Who is in control" and often took the wrong decision in selling or buiyng the market? ( your note on the broken 1.40 on the JNS or JNY chart was clear)

          The point is that being so sure of the "control" is a relatively easy tasks.

          Per example take the S&P: who is in control?. IMHO the 5/17 and the 5/35 , not the commercials. Am I m right? If not can you tell me where and how I missed my interpretation?

          Thanks

          Cordially
          Last edited by fabrizio; 07-07-2003, 01:11 AM.
          Fabrizio L. Jorio Fili

          Comment


          • #6
            Fabrizio,

            Click on the following links to find the response to your last question on "Who's In Control" question.... It was a very good question, so I started a new topical tread to answer it, and posted the SP F weekly and daily chart illustrations to help answer your SP question.


            I will, also, store both text and illustration reply as a PDF file in the "Who Is in Control" folder, located at the Advanced GET User Group.


            Best wishes to you my friend, marc
            Marc

            Comment


            • #7
              JNY over 32$

              Marc

              JNY rallied up to over 32 then it the res. and closed 31.94.
              ( the missed buy out of nautica is understandable. Nautica has been damly overpaid. Nautica is at an irrational 27+ P/E . with Ebitda barely above 8% and net profit of 3% )

              Cordially

              Fabrizio
              Fabrizio L. Jorio Fili

              Comment


              • #8
                Fabrizio,

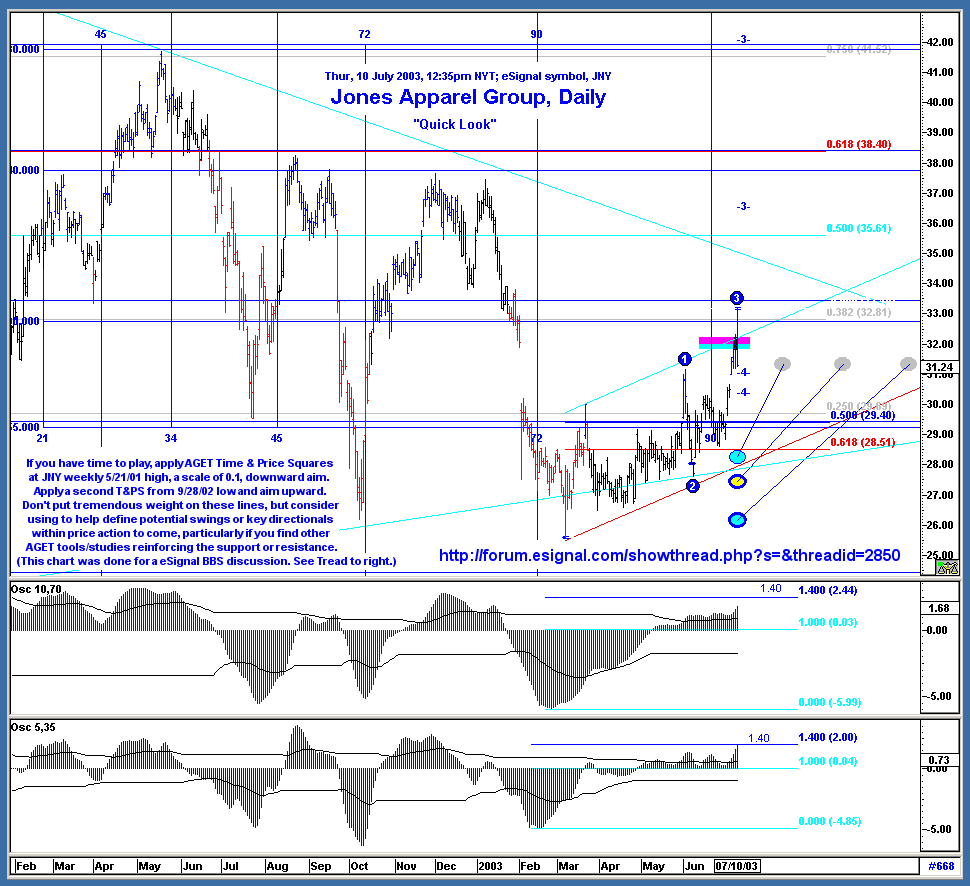
                First, thanks again for your Janus Group (JNS) idea. It turned out to be a nice Type 1 Buy! It went from the W4 low of 15.53 (6/24/03) to 18.38 high (7/8/03) yesterday. Nice play. But now to following up on what you really are interested in-- the Jones Apparel (JNY) buy idea you suggested last week:

                (1) Go to a monthly JNY. Add TJ’s Web in extended mode. Use NU and ND lines as support. Below ND, it would be very hard to stay long.

                (2) Go to a weekly JNY. Do trendline analysis from the past 6 years. Can you define a triangle pattern? Add a retracement (Fib Ret) from 2001 high to 2001 low. Add Time & Price Squares (T&PS) at 5/21/01 high, scale of 0.1, downward aim. Add a second T&PS at 9/28/02 low, aim upward.

                (3) Go to a daily JNY. Add a retracement from March low to today (7/10/03) high. Monitor 10/70 and 5/35 Oscillators; will they continue to strengthen? The 5/35 testing the 1.4 but will the 10/70 move above 1.4 as well? If so, this is bullish. We still need more oscillator confirmation to become more bullish.

                Remember a couple more key things:

                (a.) Remember you are going counter to the daily wave count. Therefore, call wave count from March ’03 low either "Wave A or 1, Wave B or 2, Wave C or 3." You are bullish this stock, and have some reason to be optimistic. JNY continues to ‘stair-step’ higher in a series of higher lows and higher highs where odds slowly improve for you. However, more substantive evidence still needs to confirm your buy idea. Better safe than sorry, so have a clear exit strategy if holding Long a while and nothing happens.

                (b.) Notice the February gap is now covered with yesterday's push to 33. Do not rule out a 'sucker' rally or a continuation of a complex correction. Another reason to apply a tighter trailing stop on at least ½ of any position you may take.

                Based on additional AGET tool application, there are three support areas I would consider aggressive buys: 29.95, 29.40 and the 28.50 area.

                Below 28-- count me out, flat, taking my lumps and loss, am gone, having a pity party, taking a vacation, will never let my wife ever buy Jones Apparel clothes again. (With my luck, watch it drop to 27.50 then rally to another new high!)

                You could still use the Ellipse study to help you better time an entry idea? Take an aggressive calculation, 6/9/03 low to 7/10; a second conservative calculation, 3/6/03 low to 7/10 high.

                In closing, this is a real-time trading training exercise to help my friend. Let's keep watching this to see how it works out and what we can learn from it.

                - Marc

                Last edited by MR; 07-11-2003, 07:15 AM.
                Marc

                Comment


                • #9
                  Marc , my friend

                  Thanks for the lovely, exaustive answer!!!!!!!! I'v learned again something more ( as usually )

                  Gosh ,You are really something!

                  My warmest regards


                  P.S. I'm Happy for JANUS!! you see how is life? Looking for mushrooms we found a Truffle!
                  Fabrizio L. Jorio Fili

                  Comment

                  Working...
                  X