Announcement

Collapse
No announcement yet.

Ellipse and Fib retracements

Collapse
X
 
  • Filter
  • Time
  • Show
Clear All
new posts

  • Ellipse and Fib retracements

    Hi:
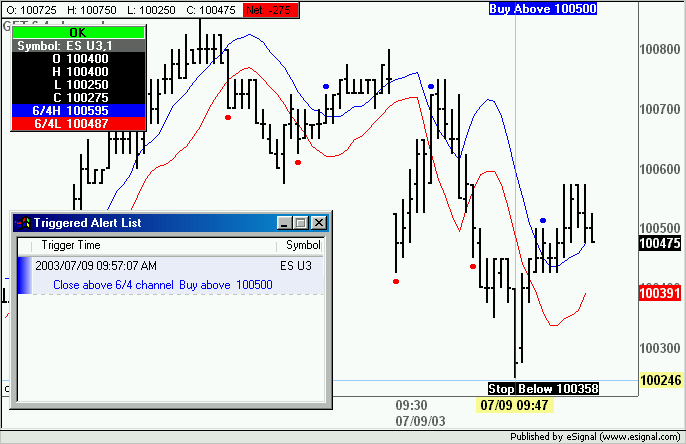
    I am looking to create an alert based a price swing retracement.
    What I have noticed is that the Ellipse and Fib retracement numbers (38%, 50% & 62%) come together in many instances.
    Question: does anyone else have an idea or product to measure price retracements besides the ellipse or Fib retracement?

    I have attached a chart to stimulate some ideas.

    Thanks
    Attached Files

  • #2
    I am great with coming up with ideas, but you may have to find someone else to figure out how to do them. These comments to come are based mostly after a 'quick look' at the chart you attached.... I would like to use have an alarm telling me when these 6/4 DMA lines are hit, in this example the lowest line having the strongest value. In addition, I would like to possibly combine or add a fib retracement measurement from the bottom low (w3) to current w4 top where the 6/4 DMA lines intercect if both were hit. I would like to know when or if the 5/17 were ever to pull above or below 1.40 in either direction of the previous oscillator negative low or postive high. I would like to have a backup alert using a more sensitive XLT setting (as low as 7) telling me when it changes color to a blue or red when the standard default XTL setting of 35 still is black. If using an optimized Parabolic setting where the last three primary price swings are all contained in a uniformed manner, I would like to know when it were broke or touched. If this chart were say an hourly chart I would like an alert to tell me when the neutral zone or extreme levels were violated using a daily TJ's Web level. Again, these are just quick ideas.... if someone programs such a beast, please give me a copy too! - marc
    Marc

    Comment


    • #3
      Marc
      Not sure how all the items in your list would be done and/or put together, but given that one would have to start somewhere here is an efs that plots the 6/4 DMA channel and generates Alerts and signals on the chart when the channel is broken on a close basis.
      As an aside Source, Length and Offset for the simple MAs used in the efs can be modified through Edit Studies.
      Alex

      Attached Files
      Last edited by ACM; 07-09-2003, 07:08 AM.

      Comment


      • #4
        Thanks Alex.... it looks excellent! I am going to play with
        the efs. Hope you had a great july 4th weekend my friend.
        Keep up the good work. - marc
        Marc

        Comment


        • #5
          Marc
          Thanks for the compliments.
          FWIW the efs generates a signal every time there is a breakout/breakdown of the channel.
          The efs may need some refinement with regards to the suggested Stop as that should be the most recent high/low swing created by the MA opposite to the break
          Alex

          Comment

          Working...
          X