Announcement

Collapse
No announcement yet.

Interesting Chart Patterns To Monitor In Coming Days...

Collapse
X
 
  • Filter
  • Time
  • Show
Clear All
new posts

  • Andy!!!! Hi!

    Yes, it really is possible Sugar futures could be affected by this and hurricanes, in general. To better understand that relationship, how Ivan would affect that market, I would have to do a quick check on some variables also affecting that market. For example, Cuba is a big sugar cane producer. How is their current sugar cane crop doing, is it harvested or already harvested? What is the curent supply and demand situation for sugar? You have to also check out things like competing sugar producers such as how are beets doing, or corn, both can be used to produce forms of sugar. How is sugar production going on outside the Caribbean, other parts of the world and what is the current supply situation. A little bit of quick research could answer those questions quickly and give us a better handle on how this hurricane could affect the NY Sugar market.

    Also, thanks for bringing up the fact IDC bought Futuresource. I had heard about this in the rumor mill, but didn't want to bring it up in case it was a secret?

    If you need any input how to merge the two products, I might be able to help give some advice. I used Futuresource for over 12 years and can tell you they have some great features. This will really help eSignal do a better job meeting the unique needs of futures traders. Bottomline, congrat's to whoever thought up the idea. It really is a great move.

    Talk to you more later... see, i am back to my rambling self again!

    Marc
    Marc

    Comment


    • ... ON a separate note...

      I have been busy trading today...

      For better or worse, I bought 2,000 shares of BRCD today at the market.
      My stop is below 4.79, and my target is the previous high. I just wanted to practice
      what I just preached in a recent post is all... no big deal is it doesn't work out.

      marc
      Attached Files
      Marc

      Comment


      • Hi bgold,
        Originally posted by bgold
        1st. What a great thread. This my 1st post but have been a keen follower
        of your posts ever since subscribing to AGET in June after the London seminar.

        2nd. Nov lumber seem to have been a T2Sell opportunity:
        - Lumber is seasonally weak between endAug-endSep,
        - displayed bearish pattern evening Doji Star, furthermore I noticed
        - neg divergence on GET Osc and arguably in GET RSI, and
        - many other indicators like MACD, MOM, CCI etc displayed neg divergence.

        However, on daily chart AGET False Bar Stochastic shows black bar
        indicating possiblie range expansion in time!

        Can you advise me how to interpret this signal? Is decision to ignore the
        black bar a matter of risk/return trade-off?


        What does the AGET ‘false bar’ stochastic warning mean to your
        original sell setup signal? In this particular case, consider this…

        1. Consider cross-referencing LB X4 to the LB #F data?
        (This continuous contract helps illuminate a front-month behavior,
        which is very important when lumber typically only has 3 to 6 months
        of actively traded data to compare and contrast with.)

        2. Take a look at the LB X4 alternate long wave count.

        In this case, LB #F regular wave count, and the LB X4 alternate
        long wave count both show a Wave 4 pullback in progress.
        We could see lumber shoot up one more time if these ideas turn
        out to be correct. At least until this hurricane worry passes,
        do NOT rule this out!

        Let me know if this helps you at all. Best wishes, and hope things
        are going well in London….

        Marc Rinehart
        (Trading Techniques/Advanced GET/eSignal former employee, and former CTA)
        Marc

        Comment


        • Marc, Many thanks for clarification.
          See that the alt long wave count in LB X shows the pullback into wave 4. Interestingly, my charts show the LB #F as wave 5's?

          I wondered how to interpret the Black Bar on AGET Flase bar Stochastics? I noticed that reversals at major tops do often go accompanied with black bars. For example AMZN & RIMM at the end of June which reversed while there was a black bar. On the other hand, AMZN in May/June appears a great example of waiting for a reversal with NFB Stochastics.

          In your experience, is ignoring the black bar a matter of risk/reward or a venture better not entertained (damaging to discipline etc).

          many thanks, have a good weekend.
          Jeroen

          PS. Fortunately not too many hurricanes here in London. Just grey and lots of rain!!

          Comment


          • Hi again, Jeroen!

            Sorry, my mistake. I was wrong. Was in a hurry and miscommunicated.

            What I should have said--

            1. Go look at your weekly and monthly... both are showing Wave 3's in progress. Possible lumber dips in price it could still be brought up again.

            2. Localize the Elliott Wave count for the daily chart to the previous July low. Identifies as an internal w4 with w5 potential.

            Bottomline: I could see developing a condition where a nasty hurricane comes in, does some more damage, demand for lumber goes up temporarily, LB X4 charges back up until closer to expiration where they unwind more hedges. (Lumber is a big one for commerical hedge trading.)

            About the false bar question... yes, it happens more times than one might wish. So, yes, it is a risk/reward thing. Would force a Tudor Jones style of trading where you start nibbling a little bit with smaller positions to get a feel until market better defines its true real next trend potentiality. Unfortunately, nibbling at the top you have to still factor in the higher risk being taken.... is the only way I can figure out how to work around this condition. You would also find it advantageous to concentrate more on the higher time frames for possibilities. Is only way to work around this anomaly.

            Again, hope I communicated better this time. Sorry, not getting enough sleep this week.

            Marc

            (PS... hard to believe, all week, been suffering from remnants of rain left over from last hurricane. It came all the way north to Ohio, where we live. Finally getting sunny again now.)
            Marc

            Comment


            • Sure seems like their was some good short covering in many Nasdaq type stocks this week. Will it ever end?

              Anyway, hope you all had a good week trading. Wish you the best this weekend.

              Marc
              Marc

              Comment


              • Posting this LBX4 chart with fancy stuff mostly out to see how this works out later...
                will try to follow-up later... if it will help someone.
                Attached Files
                Marc

                Comment


                • MR
                  I do not have GET yet, but thinking about it.
                  Can you post a chart of SMH using 30 minutes for the last 10 days?
                  Why?
                  So I will know when GET says it is wave 3 top


                  Originally posted by MR
                  Posting this LBX4 chart with fancy stuff mostly out to see how this works out later...
                  will try to follow-up later... if it will help someone.
                  Larry Dudash
                  HAL at
                  http://share.esignal.com/groupconten...r=&groupid=549

                  Comment


                  • Larry,

                    As per your request, here is a simple SMH 30 min chart.
                    Attached Files
                    Marc

                    Comment


                    • MR
                      (1) Thanks for the chart.
                      (2) Question ?
                      (3) Once "the 3" appears on the chart, does the price start to
                      move down ?
                      (4) Or is "the 3" indicate a top is near or should be near?
                      (5) My guess is that "the 3" is just a rough guess until a down
                      move starts, but do not really know.
                      (6) Any comments on this ????
                      Last edited by MR; 09-13-2004, 08:31 AM.
                      Larry Dudash
                      HAL at
                      http://share.esignal.com/groupconten...r=&groupid=549

                      Comment


                      • Hi Marc,

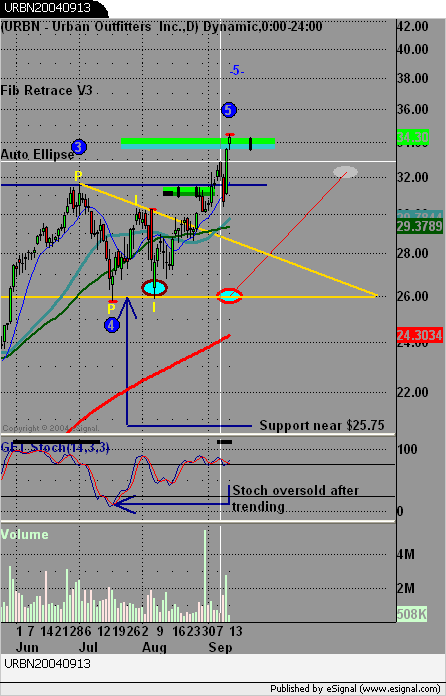
                        I thought I would again follow up with URBN. Looks like the 2nd MOB finally came to be. Not the most attractive trade ever analyzed, but the accuracy of the Advanced Get tools never ceases to impress.

                        Here is a look back to how this trade progressed.

                        Comment


                        • Larry,

                          Not sure how, but I accidently edited your box when I was trying to post a reply...It was totally unintentional and accidental... I tried to put it back to what you typed originally....

                          Will repost my reply as soon as I fix what I just goofed up.... sorry for this, needing more coffee this AM!

                          marc
                          - - - - - - - -
                          Marc

                          Comment


                          • Hi again Larry,

                            Let me retype my reply to you....

                            Originally, I posted the 30 min chart exactly as you requested. I did not really want to add anything other than what you requested.

                            I did, however, check a few things quickly, that lead me to think the SMH daily chart wanted to go higher. I still think there is room for SMH to go higher.

                            Based on the 30 min chart the next projection was taken out already this morning.

                            To better understand the wave counts and how they can help you in your trading, I would highly recommend you go the the Advanced GET User Group, under File Share, and review that material. I would also recommend you sign up for one of Nate or Ron's free Web-Ex seminars they give weekly here at eSignalCentral. I am no longer an employee, so really do not have time to teach the basics. I try hard to help when time permits, but cannot guarantee you the type of help you may need. Those free seminars are really good because you can ask Nate or Ron these types of questions and they are very good at helping.

                            To quickly answer your questions... think of the Elliott Wave as a guide. The wave 3 labeling simply means it is taking some form of a Wave 3 in progress. You use projections also as a guide. You need to use more than just a wave count to setup a trade idea. For example, I would recommend you reference a regular wave count the Elliott Oscillator. Ask yourself is this oscillator continuing to grow, for is it beginning to plataeu? Is the oscillator stronger than recent ones? There are other criterias you need to reference to, but I do not have time to share all this with you.

                            If you are serious about learning how to apply this stuff to your trading, I would highly recommend you sign up for one of the Advanced GET Web-Ex sessions, or sign up to attend one of their seminars when they are coming to your area, and go to the Advanced GET USer group and review all the material at your leisure until it begins to make more sense. It is worth the effort, I promise.

                            Again, I am not an employee, so have absolutely nothing to gain here. I can only tell you it is how I look at the markets.


                            Originally posted by larrydudash
                            MR
                            (1) Thanks for the chart.
                            (2) Question ?
                            (3) Once "the 3" appears on the chart, does the price start to
                            move down ?
                            (4) Or is "the 3" indicate a top is near or should be near?
                            (5) My guess is that "the 3" is just a rough guess until a down
                            move starts, but do not really know.
                            (6) Any comments on this ????
                            Marc

                            Comment


                            • Hey Duane,

                              First, let me congratulate you on this pick! Excellent job! It has done very well.

                              Secondly, while I may be premature in saying this, don't be surprised if it continues to exceed your expectations. I believe the daily is exhibiting Wave 3 tendencies, not wave 5 as labeled. When you reference to the weekly chart you maybe able to see what I mean by this.

                              Hence, if long this stock, you may what to consider finding a way to stay in this trade a little longer somehow. One way I do that is by not totally getting out of a stock once my objectives are over, but will rather let a portion of the trade stay open, and try a liberal protective stop (above breakeven, of course.)

                              Again, good job,

                              marc

                              Originally posted by DuaneG
                              Hi Marc,

                              I thought I would again follow up with URBN. Looks like the 2nd MOB finally came to be. Not the most attractive trade ever analyzed, but the accuracy of the Advanced Get tools never ceases to impress.

                              Here is a look back to how this trade progressed.

                              Marc

                              Comment


                              • MR
                                (1) Thanks for the chart.
                                (2) I have seen all the videos and they were helpful
                                (3) Plan to use Les's Numbers rather then Get_Osc
                                (4) To find out more about Les's Numbers just click two URL's
                                below.
                                (5) Esignal has come a long way since I signed up many years ago.
                                (6) The efs are very good for a programmer like me.

                                Originally posted by MR
                                Hi again Larry,

                                Let me retype my reply to you....

                                Originally, I posted the 30 min chart exactly as you requested. I did not really want to add anything other than what you requested.

                                I did, however, check a few things quickly, that lead me to think the SMH daily chart wanted to go higher. I still think there is room for SMH to go higher.

                                Based on the 30 min chart the next projection was taken out already this morning.

                                To better understand the wave counts and how they can help you in your trading, I would highly recommend you go the the Advanced GET User Group, under File Share, and review that material. I would also recommend you sign up for one of Nate or Ron's free Web-Ex seminars they give weekly here at eSignalCentral. I am no longer an employee, so really do not have time to teach the basics. I try hard to help when time permits, but cannot guarantee you the type of help you may need. Those free seminars are really good because you can ask Nate or Ron these types of questions and they are very good at helping.

                                To quickly answer your questions... think of the Elliott Wave as a guide. The wave 3 labeling simply means it is taking some form of a Wave 3 in progress. You use projections also as a guide. You need to use more than just a wave count to setup a trade idea. For example, I would recommend you reference a regular wave count the Elliott Oscillator. Ask yourself is this oscillator continuing to grow, for is it beginning to plataeu? Is the oscillator stronger than recent ones? There are other criterias you need to reference to, but I do not have time to share all this with you.

                                If you are serious about learning how to apply this stuff to your trading, I would highly recommend you sign up for one of the Advanced GET Web-Ex sessions, or sign up to attend one of their seminars when they are coming to your area, and go to the Advanced GET USer group and review all the material at your leisure until it begins to make more sense. It is worth the effort, I promise.

                                Again, I am not an employee, so have absolutely nothing to gain here. I can only tell you it is how I look at the markets.
                                Larry Dudash
                                HAL at
                                http://share.esignal.com/groupconten...r=&groupid=549

                                Comment

                                Working...
                                X