Announcement

Collapse
No announcement yet.

Interesting Chart Patterns To Monitor In Coming Days...

Collapse
X
 
  • Filter
  • Time
  • Show
Clear All
new posts

  • Follow up on posting delays

    Hey Marc,

    I sure didn't mean to come across upset or unhappy. I thought maybe I wasn't in the right place to get the info. I wasn't sure if you were posting it somewhere else that I was suppose to know how to find. I am new to eSignals bulletin boards and wanted to make sure I wasn't out in left field.

    I totally understand and respect how busy you are and appreciate any info I can get.

    Thanks for you quick replies.

    Brad :-)
    Comment


    • Hi Marc,

      I vote yes. I have applied to your file sharing group and am awaiting approval.

      Thanks for the help!

      Comment


      • Chart of COGT ?

        MR: Can we see a chart with AGet notations for COGT ( Cogent Systems). Is this a Type 1?

        Comment


        • This is a tough call. I really don't know if this is a good Type 1? Because there is limited history with this stock, it is a little deceptive. It looks like it could be a big A-B-C correction, and maybe setting up for a Type 2???? If it is a C wave not completed it could then still turn out to be a Type 1, but that W1 and 2 do not look correctly located. I really don't know. Here is an attached chart I did for you. Hope it helps.


          Originally posted by marsi
          MR: Can we see a chart with AGet notations for COGT ( Cogent Systems). Is this a Type 1?
          Attached Files
          Marc

          Comment


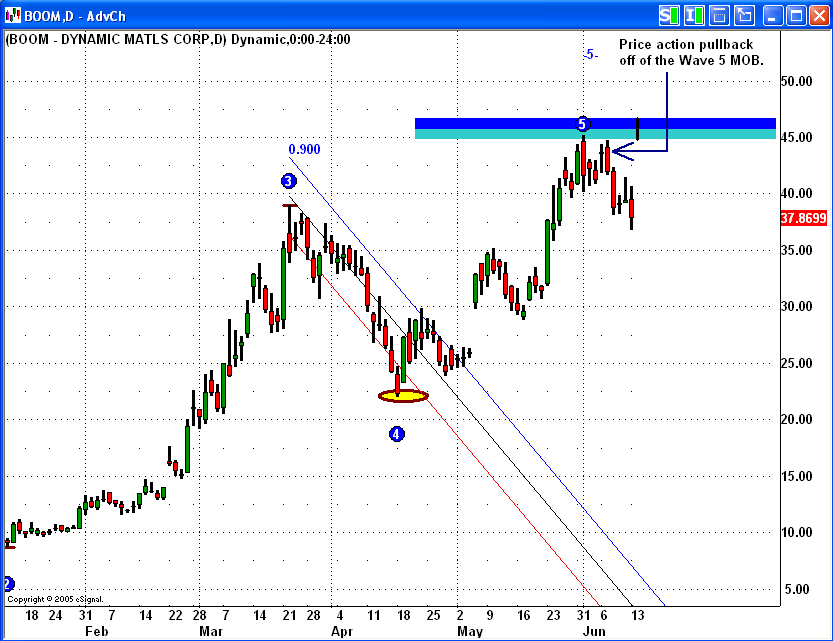
          • Looks like the like the MOB gave us a great exit point on our BOOM trade. Wave 5 was projected quite nicely and yielded a sizeable profit. With the current retracement, we can switch to a Weekly interval look for the current Wave 3 to pullback for the next possible entry.....Stay tuned.....

            Comment


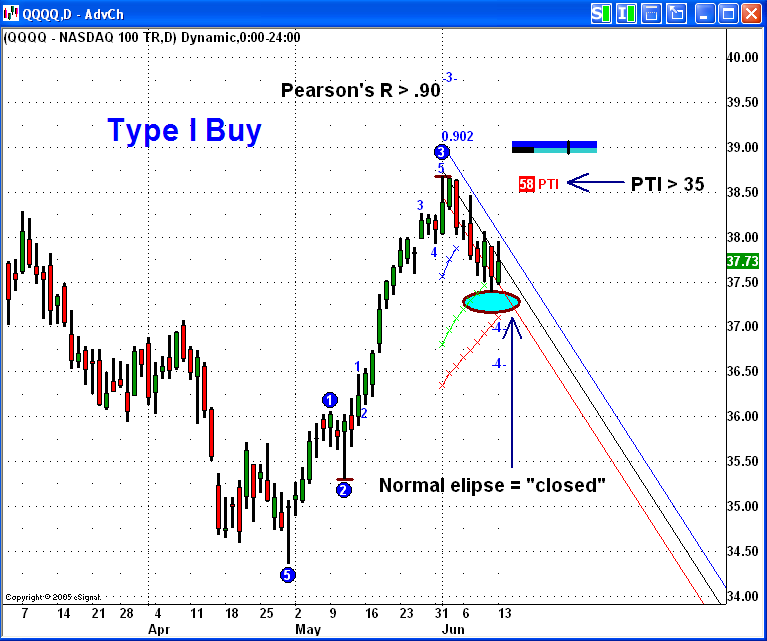
            • I used to daytrade the QQQQ's, but have switched to leveraging it as a hedge for the longer investment accounts. I came across a Type I Buy setup that I thought I would share. We haven't gotten a firm trigger on this one yet, but it may be fun to see how it plays out.

              Here's the boilerplate......

              This chart & analysis is for educational purposes only....

              Comment


              • Re: bby

                June 1st I posted a comment to watch Best Buy (BBY) for a Type 1 buy.
                Anyone able to find a buy trade in BBY this past month?
                Noticed it is up over $5 this morning! Wow!
                Keep monitoring it for any Type 1's this summer.

                Originally posted by MR-- bby - Posted: 06-01-2005 09:44 AM
                Monitoring BBY for aggressive Type 1 buy setup, but it really needs do dip down and cover some of today's gap open first?
                Marc

                Comment


                • MR
                  I have EOD AGET and couldn't find type 1 or 2 setups for the new positions posted in the File Sharing on 60 min, daily or weekly.. Are you using a different time frame? I'm new to this so excuse if this seems like a dumb question.

                  Comment


                  • I established four small postions yesterday afternoon just to test the water. Information was posted last night at MR Test File Share Group. If interested, go there to see. Attached is a chart of HOT daily, a missed Type 1 trade. Will be monitoring for a pullback and safer entry, focusing on Normal Ellipse arrival.
                    Attached Files
                    Marc

                    Comment


                    • Yes, using more than an hourly, daily and weekly. Some of these charts aren't perfect, have some intuition and 17 years of watching the markets built into my stock picks. Below is a brief explanation of those picks. By the way, I took some more trades today. Will be posting soon at File Share.

                      EPIQ- monthly shows a possible Wave 4 completed and a newer uptrend beginning, a bigger W5 in early stage... means it should keep trending higher for now. Weekly labeled wave 3 in progress and no real noticable resistance nearby. Daily alternate shows W3. I infer last 16.05 low an internal w4. If correct, we should see a W3 shift higher within the next month. Wave count will catch up and support higher picture.

                      MMSI- several time frames between daily and hourly support T1 buys.

                      BZH - was clearly a daily T1 buy, IMHO. The wave count is harder to figure out on the variable time frame data because of a large gap in the data. It looks like a unadjusted stock split. eSignal doesn't adjust their variable data, so I kind of had to use my own judgement and draw my own inferences what I think is going to happen.

                      GLW - Daily W3 in progress labeled, i infered the last pivot as a smaller level internal Wave 4 with another Wave 3 high to come, depending on if 15.95 low holds. My stop loss would be below that pivot. All I am trying to do is ride up the Wave 3 some more.

                      Originally posted by dboile
                      MR
                      I have EOD AGET and couldn't find type 1 or 2 setups for the new positions posted in the File Sharing on 60 min, daily or weekly.. Are you using a different time frame? I'm new to this so excuse if this seems like a dumb question.
                      Marc

                      Comment


                      • Is it possible to have the charts of the new positions you have taken.

                        thanks once again for the insight

                        Originally posted by MR
                        Yes, using more than an hourly, daily and weekly. Some of these charts aren't perfect, have some intuition and 17 years of watching the markets built into my stock picks. Below is a brief explanation of those picks. By the way, I took some more trades today. Will be posting soon at File Share.

                        EPIQ- monthly shows a possible Wave 4 completed and a newer uptrend beginning, a bigger W5 in early stage... means it should keep trending higher for now. Weekly labeled wave 3 in progress and no real noticable resistance nearby. Daily alternate shows W3. I infer last 16.05 low an internal w4. If correct, we should see a W3 shift higher within the next month. Wave count will catch up and support higher picture.

                        MMSI- several time frames between daily and hourly support T1 buys.

                        BZH - was clearly a daily T1 buy, IMHO. The wave count is harder to figure out on the variable time frame data because of a large gap in the data. It looks like a unadjusted stock split. eSignal doesn't adjust their variable data, so I kind of had to use my own judgement and draw my own inferences what I think is going to happen.

                        GLW - Daily W3 in progress labeled, i infered the last pivot as a smaller level internal Wave 4 with another Wave 3 high to come, depending on if 15.95 low holds. My stop loss would be below that pivot. All I am trying to do is ride up the Wave 3 some more.

                        Comment


                        • Hi,

                          I don't have time right now to do charts on those trades. It took me over an hour last night to answer that last question (see midnight post) and then I stayed up until 3AM this morning looking for new trades today. FWIW, I finally bought HOT today (see previous HOT post), and did a breakout trade on MSO just now (was not a T1). If I cannot get time to do charts, will at least show you later where my stops and targets and such are located.

                          Take care, Marc

                          Originally posted by kosmicmisfit
                          Is it possible to have the charts of the new positions you have taken.

                          thanks once again for the insight
                          Marc

                          Comment


                          • BZH

                            For those following my BZH at the File Share group, and here now....

                            I had to take profits as a part of my experiment I am documenting....

                            BUT... choses (edit this word to say "choices") others would (edit to "could") do if not limited to my test:

                            1) Just take profits?

                            2) Take 1/2 of almost $7 profit (if taken now) and let other 1/2 position ride for time being. (risk is gap covering before pushing trend back up longer-term)

                            3) Just gamble and hold full position for now, but be willing to let some of gap cover? (If you believe in the overall strength of this stock, than this option is viable.)

                            Hope this helps,

                            Marc
                            Last edited by MR; 06-17-2005, 11:48 AM.
                            Marc

                            Comment


                            • I forgot to mention it, but I posted earlier at the File Share group current positions
                              and attached a few small charts to show simple logic on those trades. Will try to do
                              more over weekend. Best wishes, and may all your trades go your way today, Marc
                              Marc

                              Comment


                              • Crude going to 60?

                                Looks like $60 NY Crude soon. (see attached CL#F Daily chart w/MOB@ $60-$61 resistance test?)
                                Market surprisingly resilient in spite of high energy costs.
                                Attached Files
                                Marc

                                Comment

                                Working...
                                X