Announcement

Collapse
No announcement yet.

Interesting Chart Patterns To Monitor In Coming Days...

Collapse
X
 
  • Filter
  • Time
  • Show
Clear All
new posts

  • Jim,
    Originally posted by jims_id
    Howdy Marc!

    Would appreciate your insight on this idea (however half-baked it might seem). What would you say the odds are that we just completed a big wave A down in the markets, and are now heading up in a B wave? With the republican convention looming in a little over a week and a potentially seasonally favorable period following labor day, could we be in store for and a-b-c advance?

    Best regards,

    Jim

    P.S. ditto Bush re-election

    No idea is too far-fetched; every idea has merit.

    The answer is, yes, there are slightly better than 50-50 odds the stock market could still 'base out' here soon for a period of time. Yes, we could even see some form of a 3-wave rally.

    Now here is the crutch. I don't honestly know what the Elliott Wave really should be lableled?

    Could it be a so-called 'X' wave pivot? The correction we are in has evolved in complexity I really don't know what to label it at this point.

    The biggest point I have been trying to make, lately, we are closing on a very critical support. Some kind of rally has to materialize soon or else the bears willl win this battle. For lack of a better term, call it a "Make-Or-Break" phase, where a deeper correction becomes problematic without a convincing rally.

    For what it is worth, I have talked to some respected Elliot Wave guru friends. Interestingly-- independent of each others Elliott Wave views-- they all seem to be anticipating a rally soon?

    Your idea is realistic. I just don't know what wave count to call it if it does rally good.
    Marc

    Comment


    • Duane,

      Thanks for sharing the Kohl's chart! Very familar with this company. My wife goes there every week to buy clothes and such! It seems to be a well managed company. Technically it did have a very interesting move today. Going to look deeper into this one.. thanks. -marc

      Originally posted by DuaneG
      Hi Marc,

      This is one that I have been watching for a few months now. Finally starting to move in continuation with the Wave 3. The volume wasn't extraordinarily unusual, but 3.8 million shares is nothing to sneeze at.....I guess we'll wait and see.
      Marc

      Comment


      • Anytime Marc!

        They just opened one of these near my house...after leveling a K-Mart of all things....I was rather struck that this pattern had the horsepower to rally off the support at $41 and push above the down trending resistance line. These patterns usually break to the flat side, but hey.... I’ve been wrong before. I guess you can tell I'm an avid wedge and pennant trader Good luck.

        Comment


        • Lumber futures bounced off the trendline and 38% retracement toward higher prices...
          Attached Files

          Comment


          • Notice on the hourly chart the similarities between the 2003 and current 2004 market...
            Attached Files

            Comment


            • It is amazing how close the two charts are.
              I went to a seminar last year from a website about program trading.
              The seminar was not really that great, but what was amazing was that the guy who ran it takes the exact day each year for the last 5 years and takes his signals from that data.
              It was pretty amazing how many times the market did the same thing.
              Mark

              Comment


              • Dean,

                FWIW, scratching the CVX and COP paper trade ideas of yesterday. I would rather take a small loss now because I think we can buy them back lower. (It was a momentum trade idea, and there was no immediate follow-though, so now on to plan 'b'.)
                Marc

                Comment


                • Hi P.Housmans,

                  Thanks for the comparison of the LB contracts. It's uncanny how closely the 60-minute interval continues to track one another even when they are a year apart. Thanks for sharing.

                  Comment


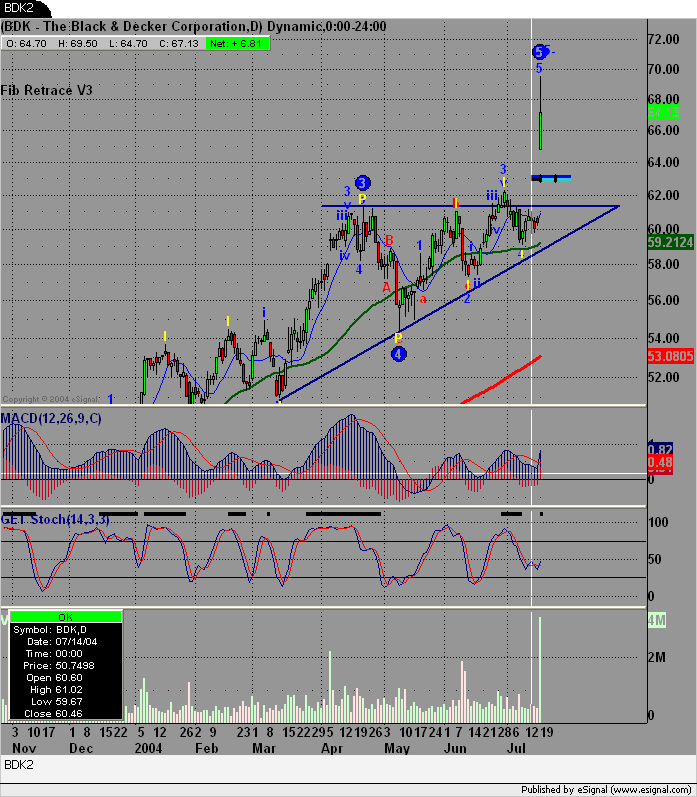
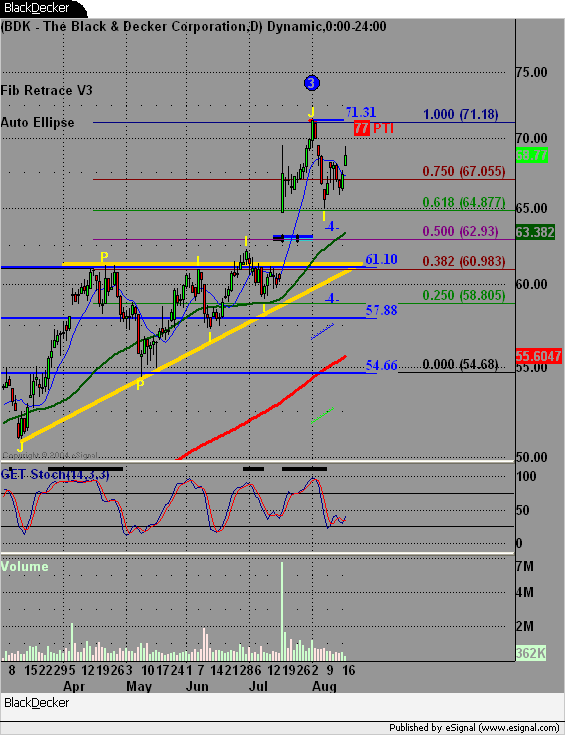
                  • I've been watching BDK for some time now. Thought I would share the pre and post trade setup. Thoughts and comments are welcomed.

                    Pre-trade Setup


                    Breakout Move on Volume


                    Post Trade consolidation

                    Comment


                    • Hi Duane

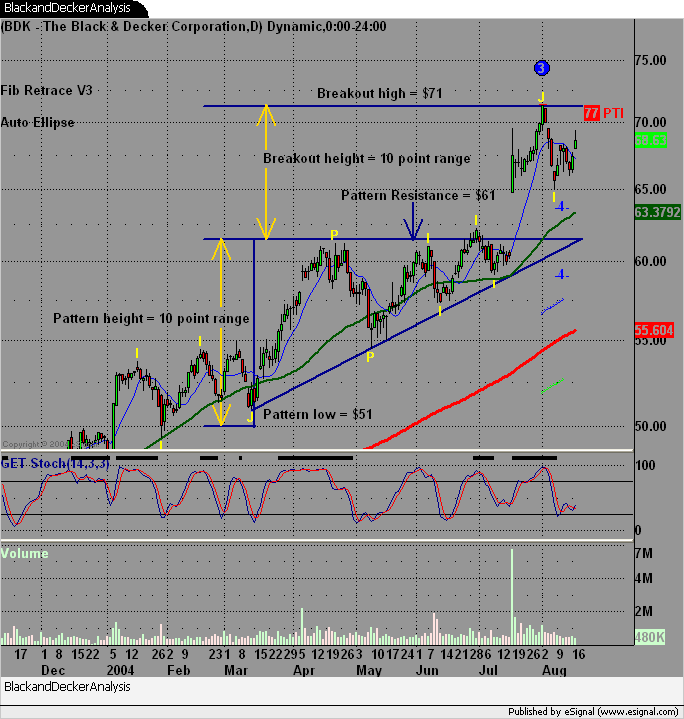
                      Just love those ascending triangles! However if memory serves, BDK looks like it's completed its triangle move and target (the target for this pattern I think is computed by taking the distance from the triangle low to the breakout point and adding this value to the breakout level).

                      So how would you play this puppy now? I know AGET shows a wave 3 up and all blue lines on the XTL.

                      Best regards,
                      Jim

                      Comment


                      • Hi Jim,

                        You got it. The distance from the low of the pattern to the breakout point should be some indication of the target. In the case of BDK, this could be a little tricky depending on how the uptrending support line was drawn. I started my line from the major pivot (J), but the support line did in fact go lower to an intermediate pivot. If I would have drawn my line any lower, it would have changed the height of the pattern and could affect any targets I had in place. In this case, we had a pattern height of approximately 10 points. The target worked out for a 10 point difference between the height of the pattern and the breakout point. I wish all patterns were this clean and readable. It is still technically in a Wave 3, so I'm tempted to let it settle down a bit before re-analyzing it.

                        Comment


                        • Hi Duane and Jim,

                          One thing not mentioned here yet with this discussion on BDK, what does the 5/35 Elliott Oscillator show?

                          Noticing when you look at the monthly, then weekly, followed by a glance at the daily 5/35 Elliott Oscillator, all three show new higher oscillator peaks. To me, this suggests if we can see the $65 (last two daily pivot lows) hold, we keep the weekly blue XTL continuation trend going. Will be watching the daily 5/35 now to see if it can grow again without crossing zero. If it does, set up the 1.40 rule to test it.

                          Just a minor thing to see if it adds to this BDK discussion.
                          Marc

                          Comment


                          • Dean,

                            Good call and good analysis in your post yesterday.


                            Originally posted by marginman
                            Ok...

                            Marc, yes gas has slipped. Inventories typically build this time of year through Nov and start dropping again as winter demand picks up. I typically look for attractive long entries Oct time frame. Recent surge in crude has left Nat Gas in its wake starting in Jul 04, Nat Gas versus crude is uncharcateristically weak so economics exist to bring price support even earlier should crude continue prolonged strength. APA, NBL have exposure to Nat Gas.


                            On COP: Daily trend is down, XTL red, if u draw RTC on daily, u see current upper channel bound is 74.55.

                            COP short term trade I was alluding to is to fine tune an entry for a continuation XTL sell, short it at say 74.55 upper RTC bound or 75.12 representing 38% retrace of hourly w3. Plz refresh my memory if continuation XTL sell is what AGET community calls this setup?

                            COP longer term trade set up is XTLcontinuation Buy when it breaks the upper bound of RTC, currently at 74.55, again tell me if continuation XTL buy is what AGET community calls this setup?

                            thanks Dean
                            Marc

                            Comment


                            • Gap filling

                              Nice looking chart and analysis for sure but what of the gap and the risk associated ie most gaps retrace and fill prior to moving on.

                              Based on the video's that I watched about seven years ago the theory indicates that one should wait and see what happens with the gap prior to entering the trade or if in, sell and see what happens.

                              Whats your thoughts on this??

                              Comment


                              • Ainsley,

                                You are correct, the gap filling is the key to BDK's immediate direction.

                                Is why I said IF it holds the last two daily pivot lows it will go higher. If it doesn't, bets are off for new buys at this time at this price area.

                                If the stock rallys from here before covering the gap, it also means something. It means the trend is still strong for now.
                                Marc

                                Comment

                                Working...
                                X