Announcement

Collapse
No announcement yet.

Criteria for w5 to relabel to w3 in any time frame

Collapse
X
 
  • Filter
  • Time
  • Show
Clear All
new posts

  • Criteria for w5 to relabel to w3 in any time frame

    Greetings folks,

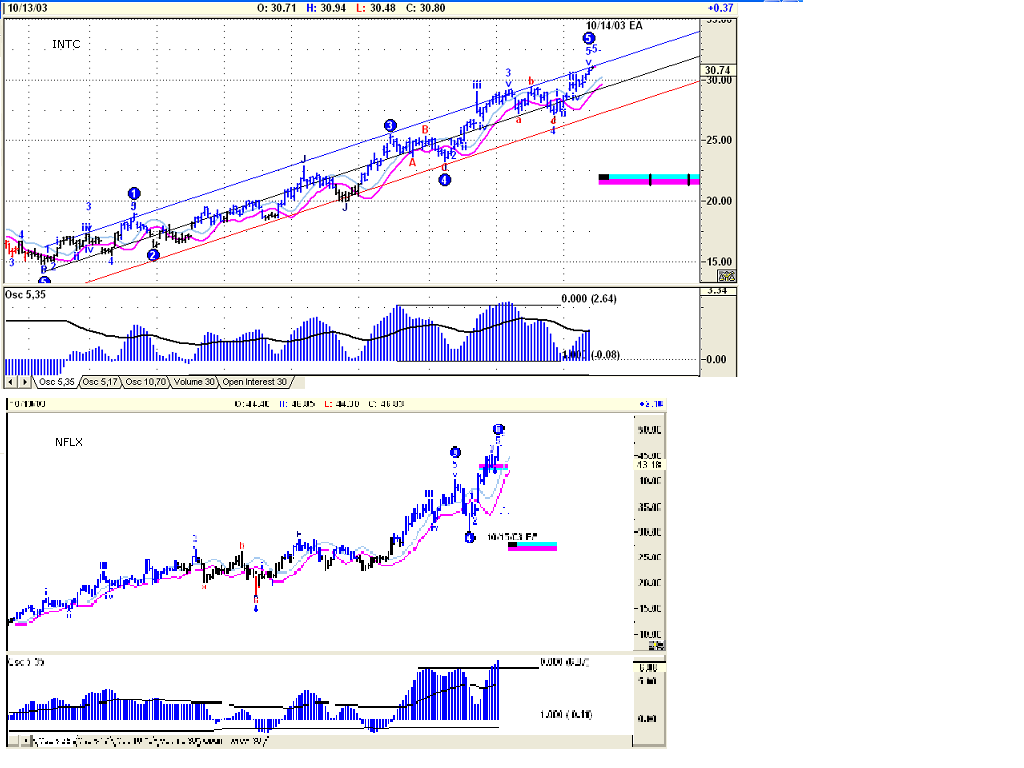
    Surely, this has been covered on this board before, I just can not quickly locate it.......but what specific criteria does EOD program use to relabel w5 to w3 in terms of any of the OSC behavior and time on any hourly/daily/weekly time frames? that is once OSC eclipses previous w3, how much later is it supposed to take before w5 relabels?

    I often see 5/35 OSC of a w5 eclipse the top of a previous w3 and yet it does not relabel to w3.......

    Thank You

  • #2
    If the oscillator makes a newer oscillator high, then we see the 3-4-5 relabel to a 3 again. It does this because of the growing strength.
    Marc

    Comment


    • #3
      Thanks Marc....That is what I recall to be the criteria but as u can see from my question.....

      "that is once OSC eclipses previous w3, how much later is it supposed to take before w5 relabels?......I often see 5/35 OSC of a w5 eclipse the top of a previous w3 and yet it does not relabel to w3......."

      Comment


      • #4
        I honestly don't know the the answer. I wish I did. It depends my friend. I have noticed, for example, on a daily it usually is a couple of days before it comfirms with a relabeling. I do know it doesn't relabel automatically. I have seen it where I thought for sure it should relabel and it didn't. There must be something built into the program that gives it time to verify a false new high oscillator??? I just have noticed when an oscillator makes a push higher than a previous oscillator, depending on the velocity behind the growing oscillator within 2 to 5 oscillator bars it usually ends up relabeling, but not always? There has to be some noticable strength to it.
        Marc

        Comment


        • #5
          Marc....Do u think this is something Mr. Tom Joseph could illuminate further, if not, how would u handle situations in which a sustained w5 suggests impending reversal in the face of potential relabeling........below are my feeble attempts at overlaying charts with MS paint...If u can read the text, the two chart examples are INTC daily and NFLX daily as of 10/13/03 close

          Kindest Regards

          Comment


          • #6
            Marginman,

            Cross referencing the daily to a higher time frame chart, or cross linking the 5/35 oscillator to a higher setting such as the 10/70 is the only way I can better figure out ways to better interpretate other wave count ideas. For example, I just happened to post a chart on INTC yesterday, or look below-- (click here, scroll down until you see INTC daily, posted 10-13-03).

            When you compare this weekly INTC chart to your chart below, you will see an internal 3-4-5 labeling, but the real thing one notices is the original wave count is labeling this a major Wave 3 in progress. Another thing to notice is this trend up should continue without impediment as long as it stays above the 6/4 DMA Channel. (In this instance the weekly DMA channels are working very well and they even correlate somewhat to the first -4- projection support area if there were a pullback this week?

            When you look at the daily chart you posted below, notice how the oscillator has pulled back approximately 90% a few times yet it never crossed zero. This means to me the oscillator still is a wave 3 in progress and not a wave 5. The program labels as best as it can with the data it has. If the sequence is still evolving-- as I strongly suspect it is-- then you will eventually see the 3 shift higher as the INTC daily trend continues to develop.

            When you cross link it to say the alternate 'long' wave count to see if it is confirming as well, is this a wave 3 still? When you look at it, it shows a wave 3 in progress, with w4 projections similar to the daily wave count. The 10/70 oscillator corresponds with the alternate long wave count, so when we look at it we see oscillations that have continued to peak higher each time that the previous internal peaks (since it crossed above zero back last March '03). We can also notice the oscillator still is above zero. Until it crosses zero the current wave action in progress is still some sort of a same wave count action. Hence, I still think it is a wave 3 in progress, similar to the daily.

            Now here is the clinker... it is very possible the wave count as it exists now is some sort of a 3-4-5 in progress, but maybe it is an internal 3-4-5 within a bigger wave 3? I don't know? I just know if it were to pullback-- if it were a little pullback it is a smaller w4; if it pulls back more it is a bigger W4. We either need more divergence on the oscillators to better guess if this is going to become a topping action, or we continue to ride the trend, or figure ways to get safely in the trend on pullbacks, with proper risk/reward setups of course.

            I haven't looked at the NFLX yet, but I bet you it is labeled a wave 3 too or looking very similar to the INTC chart... I would apply the same cross referencing and cross linking to this chart and I bet is starts to make a little more sense.
            Attached Files
            Marc

            Comment


            • #7
              Here is a quick daily INTC to visually help build picture what I am trying to say below...
              Attached Files
              Marc

              Comment


              • #8
                Marc

                All your post are interesting , but whn I read some like this one I got H.......ny!!!!

                Great!

                Thanks
                Fabrizio L. Jorio Fili

                Comment


                • #9
                  Fabrizio my friend, where u been? I haven't seen you hear for a while and was wondering how you were doing? Hope things are well with you? It is good to see you here again! -marc
                  Marc

                  Comment


                  • #10
                    The "Daily" long term alternate wave count shows w3 in progress instead of w5 corresponding with daily 10/70 OSC on both INTC & NFLX .....Thanks Marc , that is one additional clue to inspect along with 6/4 DMA in anticipation of w5 relabeling to w3.

                    Respectfully, it has been my observation, consistent with numerous citations of the same on this board, that the weekly chart wave in progress is less helpful to determine exit and entry for short term sub 14 day duration trading. The pull backs on daily can have deleterious effects on long positions in terms of lost opportunity had positions been closed and reentered after pullback to ride the existing long term trend.
                    Last edited by marginman; 10-14-2003, 11:02 AM.

                    Comment


                    • #11
                      My dear Marc

                      Studiyng and Trading, Trading and studiyng...... and reading your posts!!!

                      Kidding, I had to catch up the loss of Thursday ( 4.8K Euro) totally recuperate from Friday to Today at 4:30 PM........

                      I did a mistake ( I was struck by that long impulsive bar on 30 Min) and I had to fix it....you bet...!!

                      Ciao !!
                      Fabrizio L. Jorio Fili

                      Comment


                      • #12
                        .
                        Originally posted by marginman ..... Respectfully, it has been my observation, consistent with numerous citations of the same on this board, that the weekly chart wave in progress is less helpful to determine exit and entry for short term sub 14 day duration trading. The pull backs on daily can have deleterious effects on long positions in terms of lost opportunity had positions been closed and reentered after pullback to ride the existing long term trend.
                        If we use the daily chart to initiate and manage a trading position, we must at least reference some analysis time to its weekly chart. A glance at a monthly never hurts either.

                        I will never forget a time in the 1990’s when my former boss came running into my office all upset. He bought 10,000 shares of Lotus stock, or whatever it was called before IBM bought it later. Earnings came out after hours, next day Lotus opened down $10. The 'friend' who talked the boss into buying this stock never mentioned anything about earnings coming out. (It wasn’t me, honest!)

                        My boss, in desperation, wanted to start dollar cost averaging that day. I told him to wait.

                        After I did some quick weekly chart analysis, I pointed out what price he should wait till before buying more. I remember he didn't like it when I told him where it was going. Incredibly the stock went exactly to where I told him. (I am telling the honest truth!) We used the daily chart to start the dollar cost average and he managed to work his way out of this mess as smoothly as possible using a combination of a weekly perspective with a daily money management approach.

                        I mention this story, partly because it kind of reminded me of the INTC chart I posted yesterday… I didn’t remember yesterday when someone asked about the stock that it was coming out with earnings today. Plus, it reminded me of the importance of using more than one time frame to better frame up a trading idea.

                        No matter what the daily Elliott wave says, if trading a daily chart, please reference to the weekly, maybe glance at the monthly. It only helps; it very rarely hurts.

                        We may not trade the weekly, but we certainly can allow it to open up our eyes to other daily chart considerations. It helps me better “observe for the obvious, yet anticipate the unexpected.”
                        Marc

                        Comment


                        • #13
                          Skillfully stated and for that my sincere appreciation......The example with Lotus is one in which the longer term view is necessary to establish entry or exit.......Yet, many weekly charts have lately shown me a wave 3 in prgress with occassional projection of a wave 4 channels while daily charts experience significant 38%+ pullbacks into w4, and rally back up in a wave 5. It is this type of behavior to which daily points to better exits and entries. The lost opportunity refers to exiting at the peak of w3, reentry at the bottom of w4, and again exiting ahead of decline after daily w5...all of which while weekly is still showing w3 in progress.....while that is not easy to execute but it is nevertheless the theoretical opportunity.

                          In large part due to your counsel, I solenmly swear that I have and will continue to crossreference with both weekly and monthly and advocate their use.

                          P.S. It is not readily obvious without pointing it out but Plz look back at the INTC chart I posted and see date and EA (Earning Announcment) next to the w5 label.

                          Comment

                          Working...
                          X