 Tweet
Tweet
EFS will not work in the stand-alone Advanced Get software. The EFS engine is built into the eSignal software, so if EFS and the Advanced Get tools are both a requirement, then going with eSignal is the best option.
-
Regards,
Jay F.
Product Manager
_____________________________________
Have a suggestion to improve our products?
Click Support --> Request a Feature in eSignal 11 -
Re: all oscilators in 1 study
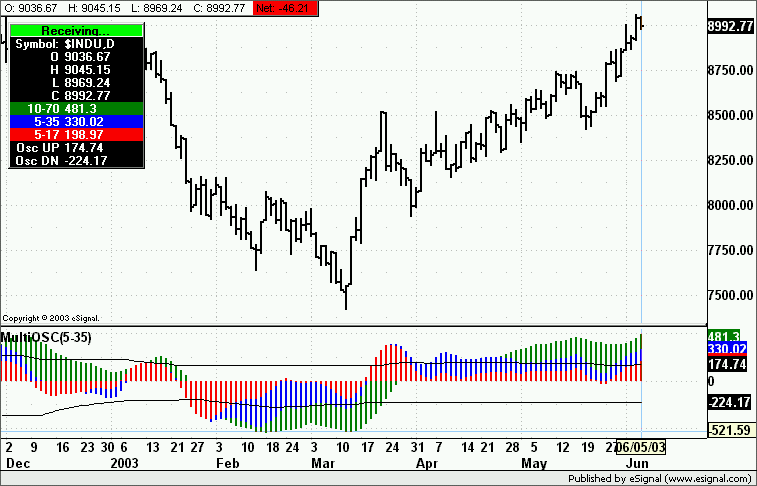
In addition to Alex's excellent comments, below is an attachedOriginally posted by gregg1
I have been seeing on these posts where all 3 oscilators
5/17, 5/35 & 10/70 are shown in the same study window (superimposed). How can I do this?
Gregg Updike
chart which shows how I use this new feature. It explains
how to merge the studies with existing pages, and because I
still prefer to see the Strength Bands, this is my preferred method.
Misc 'merging indicators' tips:
(1) Change the 'Strength Bands' colors before merging.
For example, I change my band colors to the same
color as the corresponding oscillator, or a brighter color
because I am partly color blind. After the indicators are
merged it becomes a difficult thing to change.
(2) Select "Tile Studies" first to begin the merge process.
(3) How you merge determines how the merged indicators
are layered over top each other. For example, make any
changes needed for the 10/70, 5/35 and 5/17 Oscillators.
Then hold the <shift> key down and drag the 5/35 overtop
the 5/17. Now key the <shift> key down and drag the
10/70 overtop the combined indicator window. They should
all now be layered in the proper order, in a usable manner.
(4) If you make a mistake, highlight your mouse, right click, and
look for the "Un-Merge Studies" selection. Then try it again.
(5) As of now, this new feature works on on the eSignal software
and is not yet available on the EOD AGET versions.
(6) The merge feature in the eSignal software works with other
indicators or studies. Because I am primarilly interested in
these three AGET indicators I show them, but you are not
limited to just overlaying AGET studies.
You will find this new overlay feature has some excellent advantages for AGET users. The primary advantage is it forces
one to review all three in unison. I have a bad habit of ignoring
the 5/17, and because it first crosses zero I might miss a breakout
sometimes. All three indicators have value.
The overlay indicator feature is nice because it minimizes the
normal toggling back and forth from one indicator to another
when trying to compare and contrast stages of growing strength
or building divergences. The '3-d' effect of having all three Elliott
Oscillators overlaying each other, I think, gives you if just a little edge that may be missed if you do not have a keen eye when
having to toggle back and forth between indicators.Attached FilesMarcComment
-
-
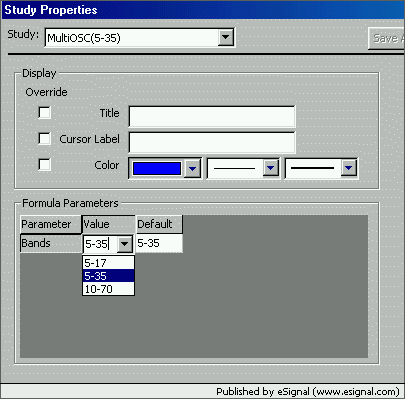
Attached is version2 of the MultiOSC.efs
This one also plots the Strength Bands
The default is for the 5-35 Strength Bands set at 80%.
Right click the indicator pane and select Edit Studies and there will be a dropdown selector to base the Strength Bands on the 5-17, 5-35 or 10-70 Oscillators (see image below)
Alex
Comment
-
Alex, all I can say is, man you are quick!
Looks like a good EFS idea! Keep up the
good work my friend. -marcMarcComment
-
Alex,
You beat me to it, I was taking the liberty of modifying your code to add bands and even as I was coding it, your message popped up.
I was going to approach it a bit differently and add all the str bands at once but make them a lighter/brighter version of the OSC color (for example lime for the green 10-70, etc). Did you try this and it make things to cluttered?
GarthGarthComment
-
Marc
Thank you for the compliments. Just very efficient in "cutting and pasting"
Garth
I tried putting all three sets of bands on but it got a bit cluttered. Truth be told they were all black which did not help.
Have not tried setting them up with different colors or creating a dropdown option to modify the order of the overlay. So, go right ahead feel free to modify/improve all you deem best.
AlexComment
-
Alex and Garth,
My hats off to both of you! I just know how to trade... this EFS stuff is new to me... you both keep doing the quality work you are doing and everyone will definitely benefit! Thanks again for your EFS efforts here... genuinely appreciate the efforts... this could become a very useful feature to AGET users.
-marcLast edited by MR; 06-05-2003, 12:07 PM.MarcComment
-
Guys
Do not tickle too much Alex : he is a pro- pro and - AFAIK- can code 3 different efs while anwering 5 questions on the board and trade 5 diffrent futures.........
Thanks alex
PS. He's ancient Uncle was Leonardo Fibonacci Da Pisa but he will never admitt it, because Fibonacci was actually from Pisa... ( a joke only Italian can understand)Last edited by fabrizio; 06-07-2003, 06:20 AM.Fabrizio L. Jorio FiliComment
-
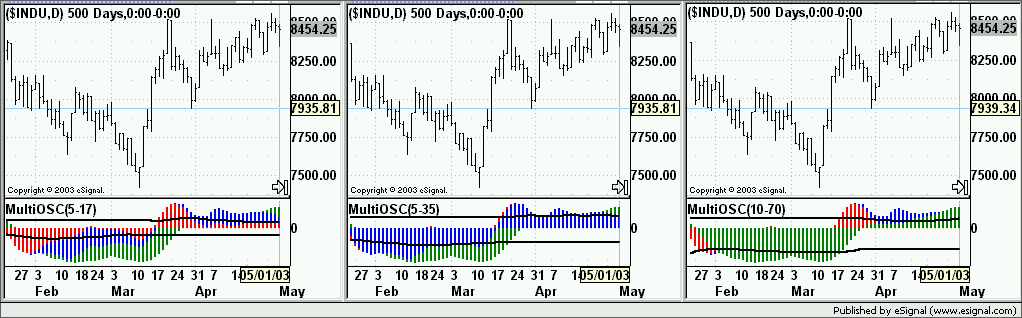
Here is a third iteration of the multi GET Oscillator efs.
Using the drop down selector in Edit Studies one can now select which of the Oscillators and corresponding Strength Bands to bring to the foreground.
The default is for the 5-17 to be in the foreground (left pane in the tryptic below) followed by the 5-35 and 10-70.
Alex
 Last edited by ACM; 06-07-2003, 11:55 AM.
Comment
-
You see ?
I told you, there we are....Fabrizio L. Jorio FiliComment
-
red, blue, green
hi, first time posting. I have a question about those blue gree and red line in wave 4. I do understan when wave 4 penetrates the line drawn from wave 2 to last X in red line, i should avoid the trade. but I have read articles and studied my own but I could not find many people who really cared much of those lines.
So, i am asking, do u guys use the lines into trading? or if other indicators are in order, is red blue green line the last thing u should be considering.
thanks for any opinions.
dave.Comment
-
My take on it:
Those lines are interesting, but not as important as the OSC pullback to zero. I might not (and usually would) take a signal that broke the wave 4 channel lines, but I would never take one that didn't have a osc pullback to about zero.
I would never count a reversal at a wave 4 channel line as too meaningful, unless the Osc also indicates that we are at a possible wave 5.
GarthGarthComment
-
I agree with Garth that the Osc "BEHAVIOR" is of prime consideration. My perception of the ~4 channels is that it is another tool to help evaluate the quality of the profit taking sequence and assessing the probabilities for an opportunity of a good ~5 (higher or lower). It does not mean that if the red channel is broken that I dismiss the evaluation of an opportunity. It usually means that the pattern will experience a 50 to 62% retracement of the previous swing. It serves as a warning that this might not be a normal ~4. The real protection to my sometime impulsive nature is, and why Garth's point is so important, that the Osc must be in place and that there is a proper trigger for any trade. I use 6/4 ma or regression trend channel if on a single slope. If these factors are viewed in conjunction (for ME) the quality of a type I opportunity is greatly enhanced.
hugh44Comment
-
Well said Hugh44 and Garth....
The Wave 4 Channels are not a trading tool, but rather more a 'visual guide' developed in the late 1980's as an attempt to help identify the quality behind a Wave 4 pullback and the Type 1 setup. Do you trade just the Wave 4 Channels, no. (but there are times I wished I did when it bounces off the blue channel only to keep going!) You just use them as a part of the process of trying to frame up a better trade opportunity if it
Statistically we know if the Wave 4 retracement holds above the Wave 4 Channels the odds for a strong second attempt is high. If the Wave 4 retracement breaks below the Wave 4 Channels the odds for a strong second attempt is very low.
For me Wave 4 Channels are an important consideration in helping identify a Type 1. It isn't the only consideration. It may not even be one of the top considerations, but it is a legitmate tool that can add insight into how, why, when, where to attempt a Type 1, particularly when you can paint a better picture using other AGET tools and studies that further identify a stronger support or resistance area to key in on in your potential trade setup.
For example, if I know the Red Channel has been broken, but below that I have a key MOB, Ellipse, Fib Retracement or Extension number, Gann line, good PTI, an XTL trigger, the .90 to 1.40 Oscillator rule working, a 6/4 DMA or RTC breakout confirmation, a cross-referenced quick double check saying it is ok, so on and so forth, I still may attempt a trade but will make changes on the management of that trade because of the higher risk associated with it. I may not bet the farm on that trade and may only do a smaller position, trail a tighter stop, take profits quicker if there is not the follow-through I would like to see. The Wave 4 Channels give me statistical evidence to guage how to trade a pullback range under the current Elliott Wave count.
Also, there are Wave count relationships that can determine how you better anticipate which Wave 4 Channel holds or not. For example, if the Elliott Wave 3 extends beyond 2.628 or higher, then when you see a Wave 4 pullback building, you can factor that into your pullback correction equation. Typically the only way the Blue Channel would hold in that situation is if the Wave 3 is still very strong, and something like a short Ellipse could help better define that setup... if it got broke, I would then look at it meaning we should expect Wave 3 not to extend any further, but now the lower Wave 4 Channels are definitely your focus, particularily if they coincide with a 50 to 62% retracement price support area.
As you get more familiar with the relationships, then the Wave 4 Channels can become a bigger part of the setup equation.
If you would like to read a few more details on the Wave 4 Channels, click on the following link:
 Attached FilesMarc
Comment
-
-
A new version of this add's buttons to allow you to change values on-the-fly while still allowing you to use the pulldowns to select your own defaults.
It also adds a button that allows you to display all the bands at once or only the bands for the Osc in the foreground.
GarthComment
Comment