Announcement

Collapse
No announcement yet.

Continuation XTL

Collapse
X
 
  • Filter
  • Time
  • Show
Clear All
new posts

  • #16
    Dean,Matt, Philippe:

    I recently acquired Advanced GET EOD and have not yet turned on the data stream. However, I’m experimenting with the program using TC2000 as the data source. I’m going to set up the scans you guys used and see what results I get. I note that the results you obtained differed to some degree. Do all three of you use real-time GET?. If not, do you use GET EOD with the eSignal data feed? Anyway, you get the idea – what’s causing the discrepancy in your scans?
    Jack

    Comment


    • #17
      Hi Jack,

      Welcome to the fray.

      I use AGet EOD with eSignal data. I have had a few stocks whose data wasn't adjusted after splits, but haven't checked to see if they have been included or excluded from these searches. Once I brought the unadjusted stocks to eSignal/AGet attention, they were promptly re-transmitted correctly.

      As you can see from my last post, Philippe and I have virtually the same results. I would hazard to guess they are identical. The XTL Up had quite a few results and I'll bet it was a simple transcription error. We are using the same searches.

      Read through the other XTL threads as well as the recorded presentations and the posts Marc has in the File Sharing section. Then read them again. It finally starts to sink in after several readings. I think I'll go read them again now myself.

      Look at the charts that Philippe has posted. They are excellent examples.

      Cheers, Matt
      Cheers!

      Matt

      Comment


      • #18
        Matt, in response to your question about retracements: I have not studied it systematically, but the smaller the retracement, the more continuation potential there is (more buying or more selling pressure). As for targets, MOB's are good, -3- or -5- labels on the charts to take off part of the position and let the rest go until stopped out. A combined active-passive approach. Philippe

        Comment


        • #19
          Philippe,

          What program are you using for your screen captures? I have used Snag-It but get much lower quality than yours along with huge file sizes. I had a chart or two to post, but I'm not going to post a mega-pixel file.

          Thanks,

          Matt
          Cheers!

          Matt

          Comment


          • #20
            Matt
            FYI an exceptional and free image viewer/editor that can handle almost any graphical format is IrfanView which you can find here
            Alex

            Comment


            • #21
              Matt, I use Snag-It32 4.2 with GIF output.
              Philippe

              Comment


              • #22
                Thanks Alex and Philippe,

                I apologize for this diversion.

                I guess I have to change my screen resolution from the high rez 1400x1050 to 800x640 to get something readable when reduced to a small file size.

                Arrghhh!! This is frustrating!

                Cheers, Matt
                Last edited by mattsb; 10-21-2003, 02:55 PM.
                Cheers!

                Matt

                Comment


                • #23
                  The continuation XTL is a great trade setup. However, I tend to move the protective stop up quickly (in a long trade), or down quickly in a short trade. Here is an example of an easy XTL continuation trade in the Dec Euro (ECZ3), stopped into a long position on Oct 21. We may have the opportunity of a quick short trade based on divergence on the 60min.

                  Next a very strong buy signal on the December live cattle (LCZ3), triple signal: XTL continuation, reverse XTL buy and "buying with the trend" signal based on XTL and stochastics. Enthusiasm is a bit tempered by PTI=31, which most likely results from the steep selloff in the last week. This could become a mega trade, time will tell...

                  Enjoy!

                  Philippe

                  First chart: December Euro as of 10/20/2003 daily
                  Attached Files

                  Comment


                  • #24
                    Dec Euro 10/24/2003.
                    Attached Files

                    Comment


                    • #25
                      Dec Euro 10/24/2003 Hourly chart
                      Attached Files

                      Comment


                      • #26
                        And finally, December Live Cattle (LCZ3), daily chart.
                        Attached Files

                        Comment


                        • #27
                          Hello folks......

                          1. Running the scans on the entire 11000+ issues list takes too long so first thing I restrict the portfolio to optionable stocks, this cuts it down to current list of 2247. If u have Esignal wizard, this would the selection directly below the current issue list.

                          2.Again the parameters for this search are repeated for verification.

                          Scan is run on daily time frame, 1 bar
                          Parameters for Up break Continuation are:
                          XTL: Period=35, Direction=up, First Breakout= unchecked
                          ATC: Type=close Break, Break Direction=up,Min Pivot= intermediate, Source: H-L flip, Std Dev= 2, checked

                          Parameters for Down break Continuation Search are exactly similar, except XTL direction and ATC Break direction are both set to down.

                          3.10/27/03 EOD Search yielded 104 of 2247 in the up direction and 2 of 2247 in the down direction.

                          In the down directions, results were:ANPI, NBIX
                          How does this compare with your results.

                          4. Below I wil show a couple of interesting candidates for up break XTL continuation

                          5.To further automate process of selecting best candidates, plz consider and offer your opinion on the following:
                          a. make a portfolio of results and rerun under hourly frame.
                          b. Add a stochastic filter for %K under 25.
                          c. Add a stochastic filter for %K over 75.
                          d.Is a Pearson'r > 0.950 offer any greater significance for break?
                          e.Any Oscillaor criteria?


                          Comment


                          • #28
                            In response to the previous post, I also use the optionable stocks as the portfolio and include a volume filter (>100000) in the search. I came up with the same 2 stocks short and a lot for the long side.

                            In order to avoid information overload, I run the scans once on the weekend and place the orders for monday. I do not rerun the scans every day since it would take a lot of capital to take all signals every day.

                            With respect to filters or additional criteria, I have not formally studied %K, oscillator or other filters. Such endeavour would certainly be worthwhile. Stochastics filter would include the stocks that had significant corrections, and exclude the stocks with fairly flat corrections (and these may be the ones to take, perhaps, see below). I have noticed that when the Pearson's r>0.90 that the signal is much clearer and the risk smaller. Those would get my preference. I do use the following filters however: The stock needs to have a P/E, i.e., it must have earnings. Second filter is visual-intuitive: I like corrections that are fairly flat when other stocks tank (could be quantified in terms of %K > 25 for long and <75 or some other number for short, or in oscillator terms maybe??). And I like those that close in the upper part of the daily range near their highs, this tells me that they are ready to explode to the upside. All of these comments apply to an up market. Down market selections in reverse of course.
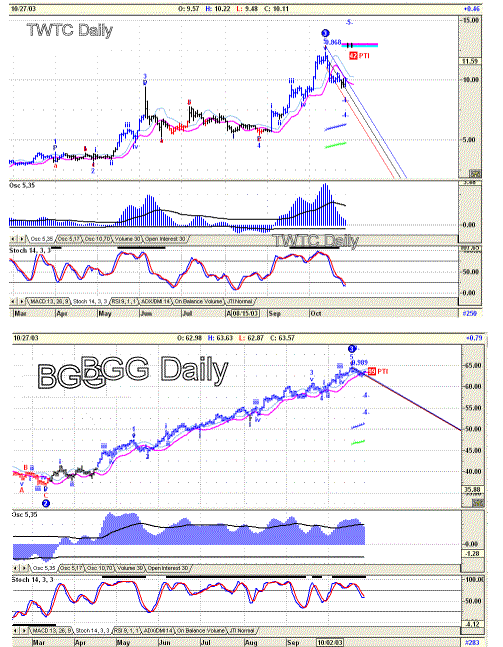
                            Looking at the examples you posted, TWTC and BGG, the latter has less of a correction and %K is greater. For BGG, the 5,17 oscillator pulls to zero but not beyond, whereas for TWTC the 5,17 oscillator pulls back more beyond the -.4 ! There may the basis for a further filter to select flatter corrections: filter for 5,17 pullback between 80 and 100% (for example) and a %K > 50 ?
                            I will run the searches and subsearches and report results later.

                            I save the daily search results as a portfolio. So every weekend I have 2 new portfolio's and can look back at what happened to the stock selections from 2 and 3 and more weeks ago. I do not carry out hourly searches on these, but it may be a worthwhile idea if one wishes to fine tune the entry or exit.

                            Finally, the other factor to consider is the general trend of the market by examining the state (in Aget terms) of the S&P500 and of the DJIA. It appears for today for example that the tone is set to strong bullish. Any stocks that turn up as short candidate in that climate may turn out to be excellent shorts when the market corrects again....

                            Thank you for pursuing this subject. Your questions make us think hard for an objective metric to optimize the XTL continuation trade.

                            Philippe

                            Comment


                            • #29
                              following up Philippe,

                              Thank you, Matt, Jack, Alexis for enagaging in dialogue

                              I typically look for moving Avg volume > 300K, Price>$9.0
                              Pearson R> 0.90, Unfortunately, it is not listed as a scan parameter. So real PE means Positive Earnings regardless of how small excluding issues with shrinking quarterly losses? Do you factor in upcoming earning dates in evaluation? Appreciate the comment about broad market action.

                              Why do u like "corrections that are fairly flat when other stocks tank"? How does this apply to continuation XTL? If trend is down and XTL break is up, do u mean that the trend down is not too steep or are u referring to some other visual...Perhaps an example would be helpful.

                              Obviously, Stochastic would rise by definition if price closes near high. While %K <25 with no false bar immediatly prior to break up would confirm buys, A %K > 25 with a false bar can be confirming. For Sells, one can use %K > 75 with no false bar, or <75 with a false bar for sells. Stochastic Serach parameters allow to specify weather or not to take in signals if false bar appears.

                              Do u prefer to use 5/17 to take in quicker signals? Why would u not prefer sub zero pullback? What is the significance of greater pullback if Pearson R is >0.90?

                              Kindest Regards, Dean

                              Comment


                              • #30
                                Dean

                                Those are very interesting questions. I do not know the answers, yet some research into past price action and the study of charts could shed some light on your questions in a systematic fashion.

                                Rapid steep retracements lead to low PTI's, low stochastics readings and the like. When price ran up fast and retraced fast, ask yourself why it did not stay in the higher prices longer? Why would it return there soon and quickly? To face more selling pressure? The PTI reading is extremely helpful in selecting the trade.

                                The use of 5,17 gives quicker signals yet some may be false. The choice of oscillator depends on personal preference and frame of reference and "Who is in control?".

                                As for fundamentals if the stock has a P/E that is good enough for me. I am not interested in earnings history, forecast, dates of earnings announcements, etc. Price action will ultimately determine profit or loss. The technical tools and the use of simple tools allow us to be on the right side of the market without having to resort to painstaking fundamental analysis, the content of which is already factored into the price action.

                                As for the "flat correction" concept: your TWTC example becomes a type 1 buy (maybe), whereas your other example BGG did not retrace as much in the same time frame and sets up for a XTL continuation buy. The trend up is stronger for BGG than for TWTC, so it think it is preferable to jump in securities that trend stronger than those that trend weaker. It is that simple.

                                I would encourage you to research this topic further and share the results of your investigations. Looking forward to answers to the market's persistent questions...

                                Easy Peachy
                                Lemon Squeezy

                                Best regards

                                Philippe

                                Comment

                                Working...
                                X