 Tweet
Tweet
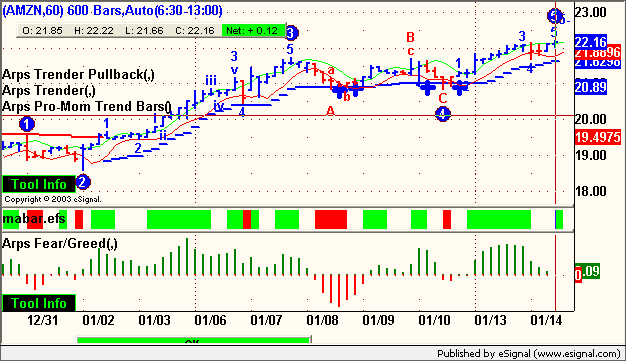
Got a question about an Amazon 60 minute chart.
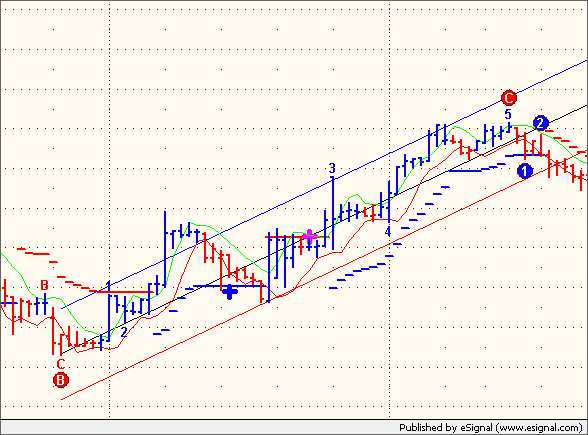
Typically when you see a B&C label, you draw a regression line from the B to the C. Then when price breaks the regression line or the MA(6/4), you enter the position. Great example below:
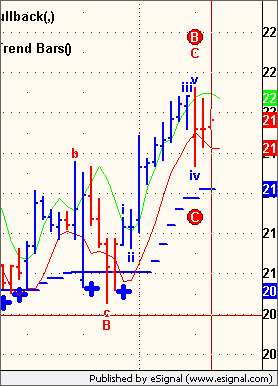
However, in this particular case, I've got a chart where the B&C labels fall on the same bar. What do you do in this scenario? Where is the entry point for the trade? At the low of the bar where the C is?
Thx.m.
Typically when you see a B&C label, you draw a regression line from the B to the C. Then when price breaks the regression line or the MA(6/4), you enter the position. Great example below:
However, in this particular case, I've got a chart where the B&C labels fall on the same bar. What do you do in this scenario? Where is the entry point for the trade? At the low of the bar where the C is?
Thx.m.

Comment