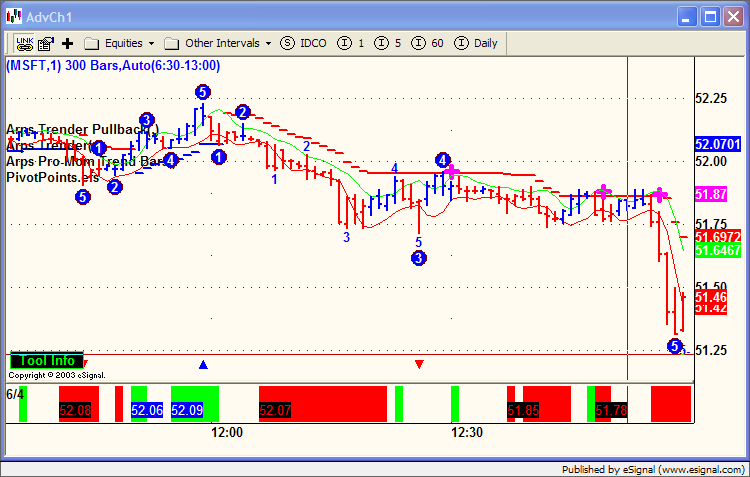
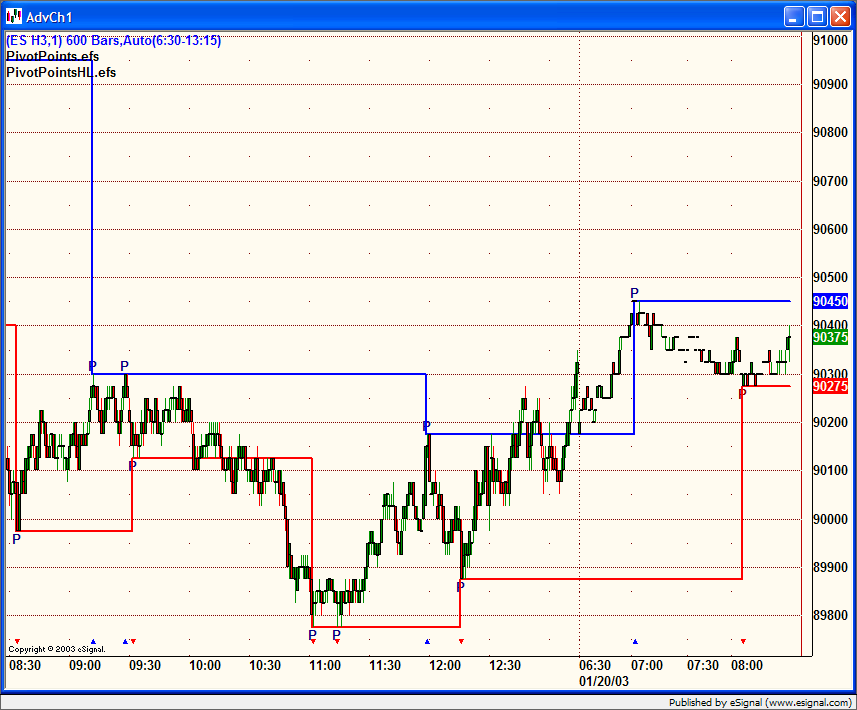
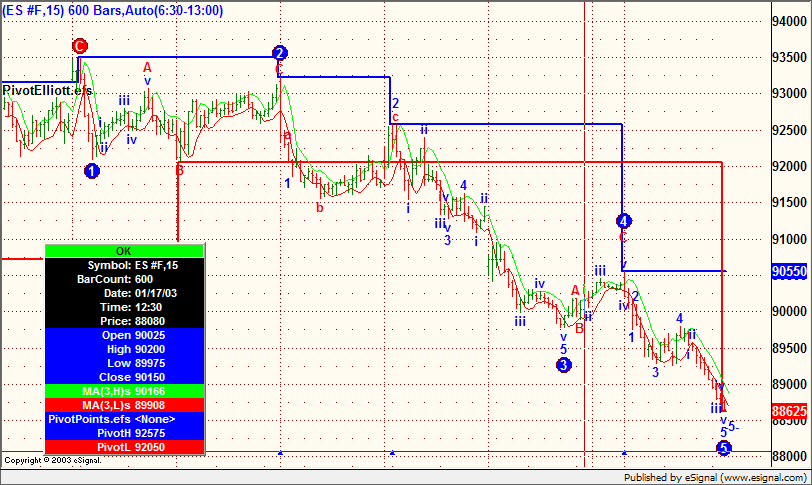
Thought I would post some sample code that denotes when a Type I or Type II trade happens based on the GET rules. This particular example uses a 6/4 moving average but could be modified for other variations.
This monitors for a few things a W2, W4, W5, or C. Then whe prices goes through the upside or downside MA, it will (in realtime) fill the study pane with red or green.
At the close of each bar, depending on the wave, if price closed above or below the MA, it will draw a text label denoting that price closed above or below the MA and at what price.
Screenshot

PHP Code:
var vLen = 6; // MA length

var vOff = 4; // MA Offset


function preMain() {

    setStudyTitle(vLen + "/" + vOff);

}


var elliott = new GetElliottStudy(300, 0, 50, 5, 35, 0);

var maH = new MAStudy(vLen, vOff, "High", MAStudy.SIMPLE);

var maL = new MAStudy(vLen, vOff, "Low", MAStudy.SIMPLE);


var nLastWave = null;

var bInTrade = false;


function PrintClose() {

   var x = close(-1);

   x *= 100;

   x = Math.floor(x);

   x /= 100;


   return x;

}


function main() {

    var vC = close();

        var vH = maH.getValue(MAStudy.MA);

        var vL = maL.getValue(MAStudy.MA);

    var vPrevC = close(-1);

        var vPrevH = maH.getValue(MAStudy.MA, -1);

        var vPrevL = maL.getValue(MAStudy.MA, -1);

    var nWave = elliott.getValue(GetElliottStudy.WAVE);


    var nState = 0;

    var nBarState = getBarState();

    if(nBarState == BARSTATE_NEWBAR) {

        if(nLastWave != null) {

            if(nLastWave == 2 || nLastWave == 4 || nLastWave == 9 || nLastWave == -5)

                nState = 1; // long

            else if(nLastWave == -2 || nLastWave == -4 || nLastWave == -9 || nLastWave == 5)

                nState = -1; // short

        }

    }


    if(nWave != null)

        nLastWave = nWave;


    if(nLastWave == null || vC == null || vH == null || vL == null)

        return;


    var bColorOK = false;


    if(nLastWave == 2 || nLastWave == -2)

        bColorOK = true;

    else if(nLastWave == 5 || nLastWave == -5)

        bColorOK = true;

    else if(nLastWave == 4 || nLastWave == -4)

        bColorOK = true;

    else if(nLastWave == 9 || nLastWave == -9)

        bColorOK = true;


    if(bColorOK == true) {

        if(vC > vH) {

            // drawShapeRelative(0, 20, Shape.UPTRIANGLE, "", Color.blue, Shape.RELATIVETOBOTTOM, "Shp" + getValue("rawtime"));

        setBarBgColor(Color.lime);

        } else if(vC < vL) {

            // drawShapeRelative(0, 20, Shape.DOWNTRIANGLE, "", Color.red, Shape.RELATIVETOBOTTOM, "Shp" + getValue("rawtime"));

        setBarBgColor(Color.red);

        }

    }


    if(nState != 0) {

        if(nState == 1) {

            if(!bInTrade) {

                if(vPrevC > vPrevH) {

                    bInTrade = true;

                    drawTextRelative(-1, 5, PrintClose(), Color.white, Color.blue,

                        Text.ONTOP | Text.RELATIVETOBOTTOM, null, 12,

                        "L" + getValue("rawtime"));


                }

            } else {

                if(vPrevC < vPrevL) {

                    bInTrade = false;

                }

            }


        } else if(nState == -1) {

            if(!bInTrade) {

                if(vPrevC < vPrevL) {

                    bInTrade = true;

                    drawTextRelative(-1, 5, PrintClose(), Color.red, Color.black,

                        Text.ONTOP | Text.RELATIVETOBOTTOM, null, 12,

                        "S" + getValue("rawtime"));

                }

            } else {

                if(vPrevC > vPrevH) {

                    bInTrade = false;

                }

            }


        }


    } else {

        bInTrade = false;

    }


    return;


}


Comment