I'll be posting some images soon. The general question I have about the MOB, as any other drawing tool, is where do you click to place these things?
Sure, you can click anywhere you want, but what particular points, time after time, tend to provide the best potential. Clicking @ a major pivot point? W5?
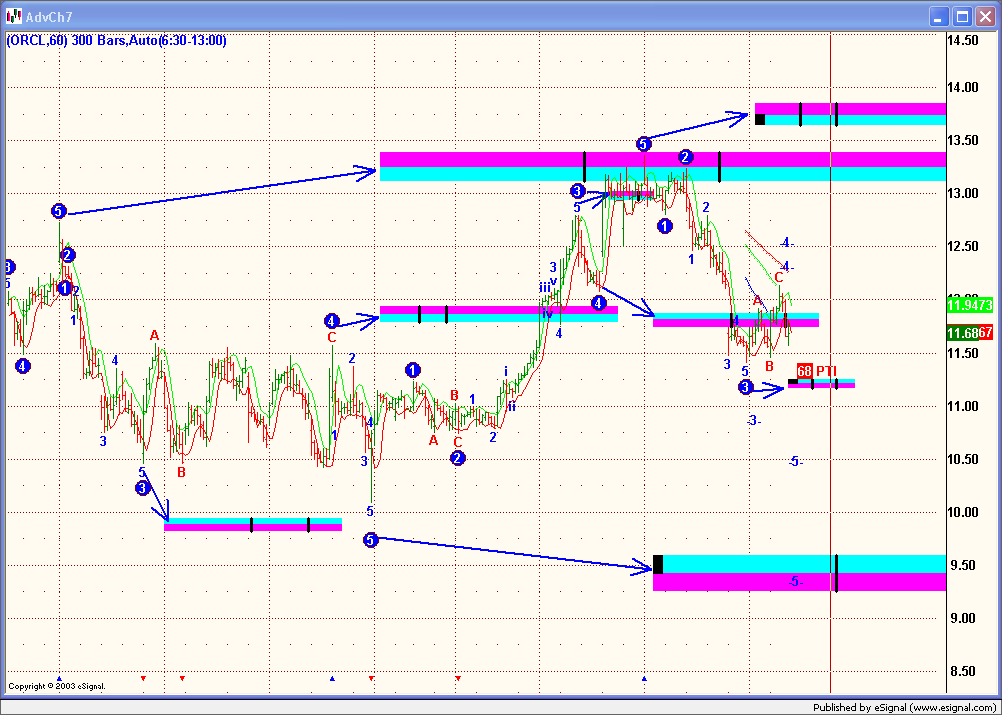
The MOB can originate from several levels. A very simple approach to Make-Or-Break application is to just focus on Primary and Major pivots. Primary and Major pivots have the greatest odds of holding a price advance. When they do not hold the advance, it is indicative of a still strong trend in progress. The Intermediary and Minor pivots MOB's tend to pause a trend and eventually fail.
Another recent example of Primary MOB applications in action.
Another recent MOB example where Primary pivots are most effective. The 'hash marks or 'timing marks' shown represent the most desirable MOB area where you would or should expect maximum support or resistance if the price intercepts the MOB inside those marks. If the price passes through inside these hash marks it suggests additional strength, or a continuation of the trend in progress for the time being. In some ways hash marks are designed to work somewhat like the Ellipse does with timing a setup.
Welp, the MOB is incredible. Unforutnately it's such a new tool for me that I'm still testing it out on paper but WOW!
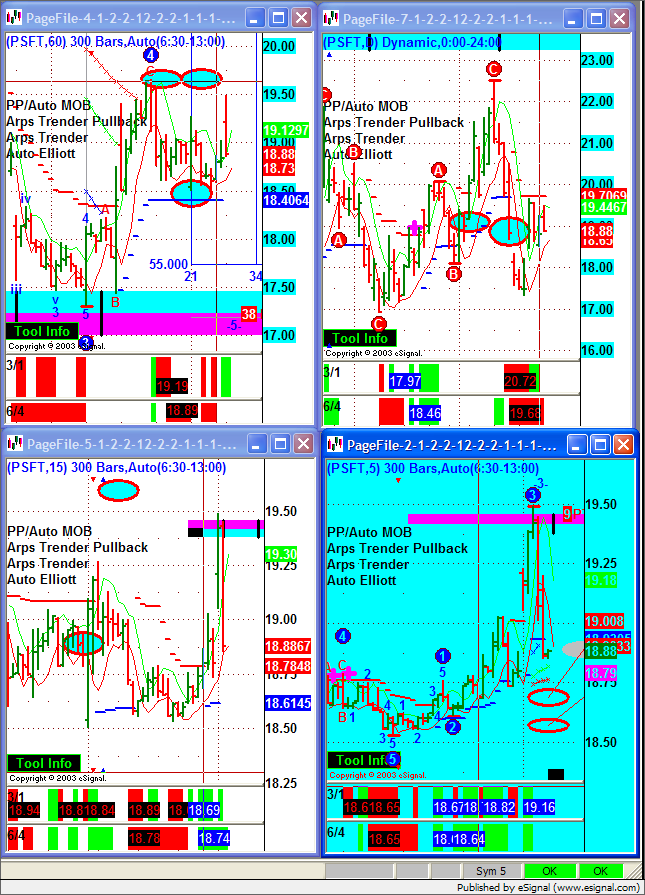
This AM I'm watching PSFT, it's launching into outerspace for reasons unknown to me. All I could think was this has got to be a headfake, where's the reversal point?
The longer term Daily and 60 minute charts say it should be going down. The 15 and the 5 are just confused. But, there was an interesting piece of information on the 15 that made me drop to an even smaller time frame for additional verification.
The 15 had a MOB around the 19.40->19.50 region. So did the 5. Adding more strength to the MOB, price was running into the MOB between the two black bars.
I couldn't pull the trigger because I'm still getting used to this new tool but WOW! Talk about a low risk entry. Could got a fill around 19.40 with a stop around 19.50. Within 15 minute it was down to 18.88.
Next time if the risk to reward ratio is that good I just may have to board that train!
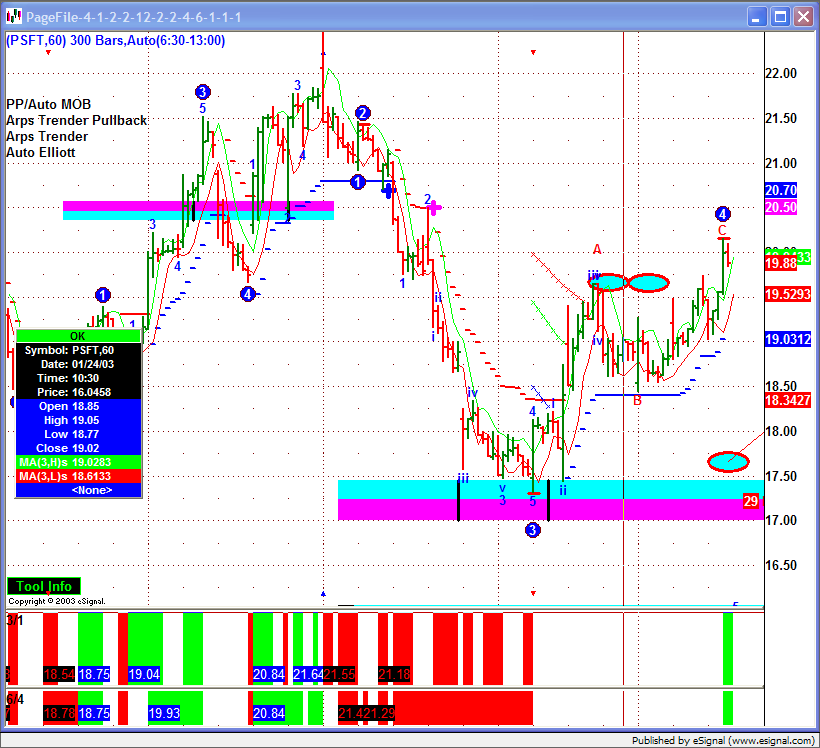
In the picture below, PSFT has a really long MOB at the bottom of the W3 (around $17). With the MOB, the focus is on time and price falling inbetween the two black bars.
If that's the case, why are some MOB's so long? Why don't they just appear where only where the black bars are located?
The Time Marks were introduced at the end of 1997 to add the time dimension but often the time part is way off base while the level itself still works amazingly well. For example, in the ES today there was a MOB level drawn from yesterday's high pivot at 15:48 where the Time Marks were way early today ( 10:48 and 11:30) but the high pivot at 13:15 today topped out just 2 ticks below the MOB way over towards its end. (both pivots were Primaries on a 3 minute chart).
When the Time Marks do work, the AGET seminar notes describe two likely behaviours:
"65% of the time, price will approach the MOB at or very near the first Time Mark.
35% of the time, price will hit between the Time marks with a slight bias towards the later one."
 Tweet
Tweet

Comment