Announcement

Collapse
No announcement yet.

Hey man, it's The Gann

Collapse
This topic is closed.
X
X
 
  • Filter
  • Time
  • Show
Clear All
new posts

  • Hey man, it's The Gann

    Alexis, Garth, Marc, whoever...

    Lately I'm hooked on the TPS line tool drawn from the most recent major pivot point. I use the TPS in conjunction with the E-waves. Lately the TPS (time lines) have been lining up well with the W5, W4, etc... +- a few bars. This isn't an original thought - I think I saw someone else talking about this in this forum (was it G?)

    I've seen y'all talk about the Gann and I'm playing with it trying to figure it out. First I tried Auto Gann and didn't see much. Then tried plotting a few Gann's and I'm not sure what I'm looking at or what to look for.

    Could someone make some real world examples and talk about them -- an educational primer???
    Matt Gundersen

  • #2
    Matt,

    Ah ha! Now you know the secret of Gann, confuse everyone. Seriously, Gann had many tools he used, of which only a few are included in most trading tools. Gann himself wrote about his techniques in a very obscure way.

    Many of his tools involved drawing complex shapes and lines on chart so that a chart will look like a spiders web, not something easy to understand to a Gann neophyte.

    Entire books have been written that only cover 2 or 3 of his techniques.

    Needless to say, to try to sum up his tools in a post would be either impossible or be so vague as to be fruitless to the reader. However, if you tell us what specific tool(s) you are interested in, we could start to cover the basics. For example - what do you mean by "plotting a few Gann's"? Which tool?
    Garth

    Comment


    • #3
      Howdy Garth,

      I was playing with the Gann Box. Hadn't tried the Gann Angles yet. Do you prefer one over the other?

      Was just trying out the Gann stuff because I've heard both you and Alexis talk about it.

      Gotta tell ya though, I'm hooked on the TPS ever since you mentioned it to me - using it for the Time, not the price.

      m.
      Matt Gundersen

      Comment


      • #4
        Hey Matt,

        Glad the TPS is working for you. I too find it an exceptional tool when used in conjunction with Elliott.

        Let me start off by saying, I am NOT a Gann expert, but I have found that some of the techniques he describes work well. I personally don't use the Gann box for trading, but needed to try to understand it so that I could determine if it was something I wanted to use. I rejected it, not so much because it didn't work, as that too much of it is subjective. I want a system I could quantify and hard code.

        The Gann box is a tool that relates time to price. Gann believed that there were price to time ratio's that were very important(for example 1 unit of price to 4 units of time), and that prices tend to move inline with these ratios.

        These ratios are based on significant divisions of a circle, and when plotted on a chart they make angled lines (for example, a properly scaled chart will show a 1x1 ratio as a 45 degree angle). Once a specific angle is broken, prices will tend to travel on the next higher or lower angle. This is much like the concept of trendlines, and as we know a 45 degree trendline does tend to be a very strong level of support or resistance.

        He also felt that where the price was in relationship to these angles determined if the market was in a strong or weak position. I must admit, that I'm not sure I agree with what I understand to be his logic on this part (though it may be a lack of understanding on my part). Certainly I have seen that prices moving on a 1x4 or 4x1 ratio tend not to move on those angles for long ("Nothing moves up in a straight line forever"), and this also is part of the theory.

        The price lines are based on price squares and also provide support and resistance.

        With GET they do a very good job (IMO) of keeping to set increments of price to time that tend to work very well. I might think this because much of it tends to match what I found to be true (and anyone who agrees with me must be a genius right ;-)?

        Anyway - you draw the boxes using various rules (this is one of the subjective points - there are many ways to start a box), but I will tell you about what I used to do when studying the validity of this method. I didn't have GET when I was doing my research, but I will try to put things in terms of the GET Gann Box.

        1) I always started drawing at the last major (or primary to use GET terms) pivot. Sometimes I would use the last two (last upper and last lower).

        2) Boxes are usually drawn before much information is known about the action after the pivot, and provide a map to potential price movements. I have found that for the way I like to trade (again, using GET terms) that I liked to pull the time out to a run of 90 and the price to a rise of 2 (these are the respective numbers in the lower right and upper right of the box). This tended to make a really good SWAG at potential price moves (Note that for the rise, it is 2 or orders of magnitude of 2). However, it isn't always the optimal setting (so this is another subjective part of the technique).

        3) Once more price data was in, I might change the ratio of rise and run to get a better match on the price action - but sometimes this also ended up being a mistake and the better match really didn't work as good as the original SWAG.

        According to Gann, if your prices find support on a "fast angle" like a 2x1 or 4x1 you would be in for a sharp move (sounds fairly logical) and the 45 degree was the most important angle (also matches what I have seen). It is also clear that you don't trade on just a break of an angle or a bounce off one, but that you use this to help time an entry or exit that other indicators might have told you to watch for (I'm sure I will get some flack on this statement).


        Let's take an example. (BTW, this is fun to play with in replay mode, it makes for a good way to practice using these tools).

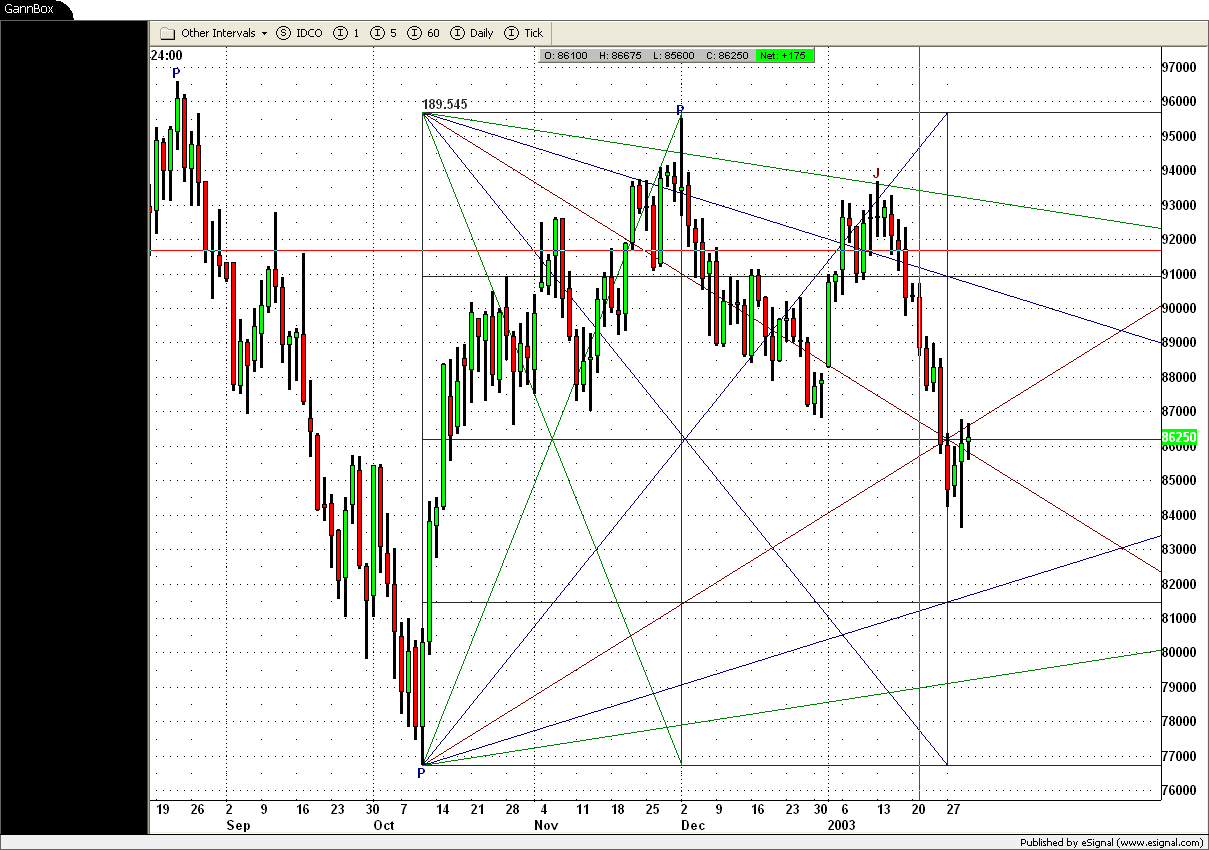
        On the daily ES #F chart if you draw a Gann box with a rise of 2 and a run of 90 from the last pivot high on 12/02/02, you will see that it followed the 2x1 angle down fairly well for a time, and the broke up as it neared the 1/2 horizontal price support, which was also near a vertical time intersection. Notice that the 1/4 price support also acted as resistance for some of this move. Prices continued up until it reached the 1x4 resistance angle and then plunged, seemly trying to find support at 45 degree. As this was forming, I was willing to bet that the 1/13/03 candle would turn into at least a major (J) pivot (and it has), I wouldn't be at all surprised to see it turn into a primary pivot (P) - and if it does we can then use this to draw the next box.

        Often if you have two boxes up (one from the last up P and one from the last down P) you can see area's where the line intersect. These often form stronger levels of support or resistance. But it is also very hard to read such charts - just too many lines.

        Another interesting chart to try this on is the IBM daily. Go back a few pivots and check it out. The rise in this case can be set to .20. This will also show you another factor - what happens when the price runs farther than the rise you initially selected? Well by the time you run out of a rise you will usually have a nice set of data points to use and it is an exercise of matching the angles with the prices presented. This is similar to what I do if the 2/90 SWAG isn't lining up well, I will use the price data on the screen to make a "better" box, one that matches the price action better.

        I'm sure other traders use this tool differently, and have different opinions. Maybe this will post will get more comments going.
        Garth

        Comment


        • #5
          Gann deals with Percentage of Price and Time. The Gann Box becomes a calculator for this and for the geometry of the markets.

          An objective way to set the Box is described in the Gann lesson I put together in the Advanced Get Group: http://share.esignal.com/groupconten...ann&groupid=20

          Attached is the last page of the lesson which shows the current Daily emini SP.

          Andy

          Comment


          • #6
            The previous attachment did not post because it was too big. This one should work. It's the current Daily contract. Once you go through the lesson, you will see how I set the box in Free Form. In this case, I started at the low and placed the first quarterly division of time at the high.

            Notice the change in trend at the intersection and the move from 25% of the upper half to 25% of the lower half of the Box (point D). 861.00 is the Balance Point which is 50% of the Box.

            Andy
            Attached Files
            Last edited by AB; 01-29-2003, 03:49 PM.

            Comment


            • #7
              Just a follow-up to yesterday's 6e H3 (March Euro Currency), that is in the Gann Folder in the Advanced Get Group of File Sharing.

              The attachment shows how precise Gann can be. Now, if you got a short off, it's money mangement and getting risk free as shown in the Gann Lesson. Short term resistance is at the Down 1 X 2. If this is recovered, then 25% (107964) becomes resistance. The market would accelerate down below the posted Speed Line.

              Andy
              Attached Files

              Comment


              • #8
                AB,

                Thanks for posting this information, I appreciate it.

                I was wondering, why, if you have two pivots you are working with you don't align the box in such a way as to fit the angle to trend lines that exist.

                Here is why I ask, I believe the box on the following chart was created as you suggest, but I find that the technique you describe does not really capture the price movement. Now I understand that not all techniques work all the time, but after looking at a few charts I find that the exceptions are more common than the ones that do work.

                If it is just a matter of not understanding the way in which you create the box, please let me know.

                Last edited by gspiker; 01-30-2003, 11:13 AM.
                Garth

                Comment


                • #9
                  Anyone have any idea why I can't inline images anymore? Even my old posts with inlined images are no longer showing the image...

                  Anyway here is a link to the image:

                  http://share.esignal.com/groupconten...png&groupid=18
                  Garth

                  Comment


                  • #10
                    Re: Reply to post 'Hey man, it's The Gann'

                    Garth
                    If I View the Source for your message it seems that the link to the inline
                    image is not the same as the ones I have for my inline images.
                    Yours appears like this (I stripped the URL and IMG tags and added spaces)
                    http : // share.esignal.com/groupcontents.jsp?folder=&picture=IBM1min2.png&gro upid=18
                    whereas mine looks like this
                    http : // share.esignal.com/ContentRoot/PrivateDemo/Images/desktopchart14.png
                    Alex
                    Last edited by ACM; 01-30-2003, 10:02 AM.

                    Comment


                    • #11
                      Thanks Alex,

                      That allowed me to fix the inline in my post. Now I one has to question why my old posts in-lines aren't showing up now when they used to. Something must have changed...
                      Garth

                      Comment


                      • #12
                        Re: Reply to post 'Hey man, it's The Gann'

                        Garth
                        Which ones are they? I was looking around before and I thought I did see
                        your inline images.
                        Alex

                        Comment


                        • #13
                          Alex,

                          Well, all of them that I looked at. But for example the ones on this thread used to display, but now don't.


                          BTW, sorry to all for hijacking this thread.
                          Garth

                          Comment


                          • #14
                            Garth, I attached the same Gann Box with some additional info. First of all, let me say this: "There is no right way to draw a Gann Box." I used to always say: "If it looks good, use it." But that was not objective enough for many people. If you like to fit the angles, and it works for you, then continue doing so. You are still capturing some of the math by fitting it that way.

                            Keep in mind, it's not just the angles that give you info, but also the various intersections of price and time. See the attachment.

                            Also, I am able to objectively look at a market and tell you if it should have continued strength or weakness. I use the same terminology with boxes within the big box. As an example, look at where the market is now. We had a change in trend and now I will expect continued strength on a short term basis if the market remains above 850.00, which is 25% of the current "small room". I'm still weak on a longer term basis because I remain below 861.00, which is 50% of the big box. I will look for potential changes in trend at the next intersections of Price and Time.

                            Andy
                            Attached Files

                            Comment


                            • #15
                              AB,

                              Thanks for the reply. I agree, there is no one way to draw a Gann box, but I was interested in learning how others do it.

                              It looks like I misunderstood how you do the run. Your second example cleared up my misunderstanding. I played with it a bit now, and things do line up much better.

                              Thanks!

                              Garth
                              Garth

                              Comment

                              Working...
                              X