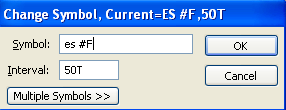
Help. I've never used tick charts and now trading ES. What do you set this to? Do you use PREM at all? Or just ES? How mand tick bars? Thanks
Announcement
Collapse
No announcement yet.
what tick chart settings for ES?
Collapse
X
-
Hi Keith,
I think you are referring to the building of tick data bars using a specific amount of tick data. Tick bars can be constructed by changing the interval of the chart to something like 50T which is 50 ticks per bar. The same format follows for 100T, or 30T.

Please let me know if I misunderstood your question or if this was what you were looking for. Thanks.
-
Keith,
A tick bar is created by trades that take place. If you set your tick chart to 55T, then after 55 trades have taken place, a new bar will start. An 89T will start to paint a new bar after 89 ES trades have been made and so on.
Your question is what tick to set it to. That depends on how fast you want to see bars get painted and how that fits with your trading style. During heavy trading, a 55T chart will really start to move. An 89T chart will not move quite so quickly. What you are likely to see in short tick charts is a lot of noise. If you are a scalper, then that may fit your style nicely. If you are a swing trader, then they would probably be way too fast.
Many people think that 1 minute ES bars are too short a timeframe to trade. Others like the fast pace. I have seen 89T charts paint bars about once every 10-15 seconds during high volume. That would be 4-6 bars a minute. Very fast to try to pull the trigger, much less determine a direction for a trade in my book.
My suggestion is to set up several charts of the ES with different tick settings. Just watch and see which one moves with your trading style. Values I would choose would be 55T, 89T, 133T and 233T. Sometimes you'll see the bars paint quickly, even on a large 233T. Other times, it can take several minutes to paint one 233T bar.
While you're at it, create 1 min, 3 min, 5 min and 15 min charts. You will really appreciate what is going on with tick charts then.
In general, a longer timeframe, either tick or minutes, will be smoother than shorter timeframes and have a larger average true range. In general only. Range bound trading will look about the same in both timeframes.
After you have this under your belt, it will be time to explore volume charts. Hope this answers your question.Last edited by mattsb; 06-01-2004, 02:51 PM.Cheers!
Matt
Comment
-
Tick charts are based on trades taking place. A trade of one contract is one tick on a tick chart. 55 trades will paint a new bar when you set the chart to 55T. It doesn't matter the size of the trade, whether 1 or 10 or 236 contracts. It counts as a tick on a tick chart.
A volume chart takes the number of contracts into account. A 250V paints a new bar when 250 contracts have been traded.
I have edited my previous post so that the information contained therein is now correct.Last edited by mattsb; 06-01-2004, 02:52 PM.Cheers!
Matt
Comment
Comment