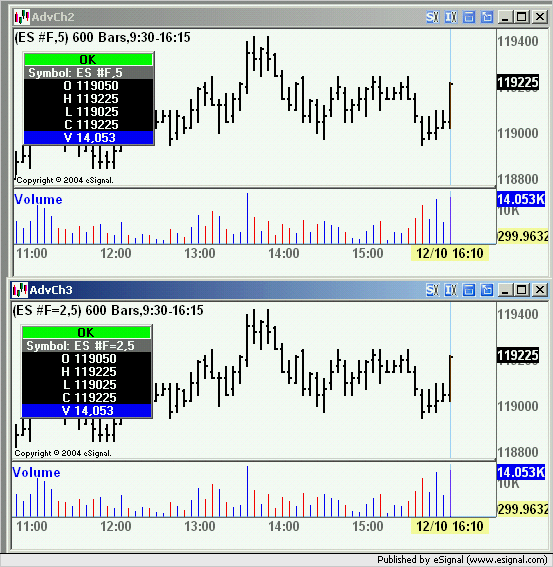
I'm plotting 2 5min charts. One chart is es #f, the 2nd is es #f=2. I apply volume indicators to both charts and notice that es #f=2 has much lower volume than es #f. For example, on 12/10/04 last 5 min volume bar for es #f=2 is 1229 contracts, but on es #f it is 14054 contracts.
Why the difference?
Thanks,
Bing
Why the difference?
Thanks,
Bing

Comment