Announcement

Collapse
No announcement yet.

Forex Daily Chart Inconsistencies

Collapse
X
 
  • Filter
  • Time
  • Show
Clear All
new posts

  • Forex Daily Chart Inconsistencies

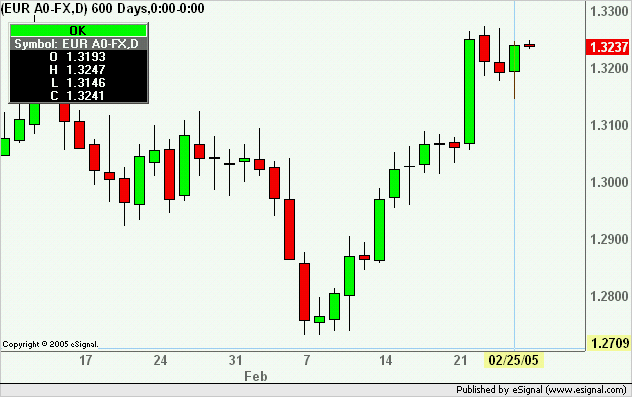
    It is my understanding that the eSignal "forex Day" runs from 15:00 PT till 14:59 PT the next day.

    The Open and Close for the above time frame using the intraday charts will not correspond to the Open and Close using a Daily Chart. This problem seems especially true for Friday's and Monday's data.

    This issue seems to have been discussed in these forums now for a number of years, yet the problems are still very much current.

    Can eSignal please make a definitive statement as to the cause of this problem, how they plan to resolve it, and when.

    Technical Analysts rely on their charts to portray accurate information. This unfortunately is not the case here, with the Daily Charts clearly showing market conditions and/or patterns that do not exist.

    Wolraad.

  • #2
    Wolraad
    While waiting for a reply from eSignal see this post regarding Start/End times for Forex
    Alex

    Comment


    • #3
      Alexis,
      Thanks for the info. If however I am using a 60 min chart, then it is my assumption that it does not matter how my templates are set up.

      Here is an example :

      Look at a 60 min chart for the EURUSD. Note the Open at 18:00 EST (15:00 PST) on 02/24/05 - it is 1.3190. Now note the Close at 17:00 EST (14:00 PST) on 02/25/05 - it is 1.3241 .(The CLose of the 17:00 60 min chart equates to 18:00).

      Now compare this with the Open and Close for the Daily chart for 02/25/05. they are 1.3242 and 1.3141 respectively - way off what the data of the 60 min indicates.

      (Today is Saturday 02/26/05 at 18:00 EST - ample time should therefore have elapsed for all charts and servers to "reset" and do whatever else servers do in order to display consistent data).

      Not only is the data way off, it also results in a Doji as opposed to an outside bar, when compared with an alternative charting package that displays the data correctly - two totally opposed candle formations !!

      I had tried to attach a png file earlier - to no avail. This doc should do the trick..

      Regards,
      Wolraad.
      Attached Files
      Last edited by wolraad; 02-26-2005, 03:54 PM.

      Comment


      • #4
        Wolraad
        If you read the specific post in the link you will see that I say that the Open/Close time does not appear to be 15:00 PST but 14:00 PST (ie 17:00 EST).
        As to the Time Template you do not need to change anything if using intervals of 60 minutes or less.
        Alex

        Comment


        • #5
          Hi Alexis,
          It does not matter in the example given below. If the Daily is then based on 14:00 PST Open and Close instead of 15:00, the 60 min chart shows an Open and Close of 1.3194 and 1.3244 at 14:00 - still way off the 1.3242 and 1.3241 indicated on the Daily.

          Your reply raises another issue :
          In the post that you refer to below, you write " . . . it appears that eSignal is using 17:00 EST as the Start/End and not 18:00 EST".

          Yet, DuaneG, another eSignal Moderator in a post dated 02/07/05 wrote "The EOD rollover for Forex data is 6:00pm EST (15:00 PT)".

          Also, the Forex FAQ in eSignal's Knowledge Base states "The Open/Close time during the week takes place at 15:00 PT."

          Three different sources with two different answers. Please help me here to establish what the correct answer is.

          Thanks.
          W.

          Comment


          • #6
            Wolraad
            I believe that what you were seeing was caused by a new session (ie Sunday's) being opened without the new bar being formed. This is similar to what happens during weekdays from the time a new session opens to the daily midnight reset.
            The Open of 1.3242 is that of the new session and once a new bar is formed then the Open of 2/25/05 resets itself to the appropriate value (see attached image)
            Alex

            Comment


            • #7
              Thanks Alex,
              It is not an ideal situation, but now that I know what is causing the anomaly I guess analyzing the Daily Chart should therefore wait till Sunday to obtain a correct perspective.


              Regards,
              Wolraad.

              Comment

              Working...
              X