Announcement

Collapse
No announcement yet.

Obtaining Historical Data

Collapse
X
 
  • Filter
  • Time
  • Show
Clear All
new posts

  • Obtaining Historical Data

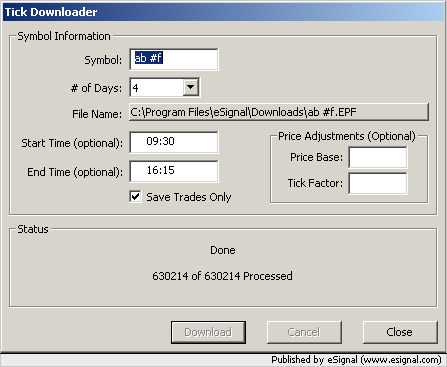
    Tick Downloader only allows me to download 10 days of Tick data. I notice in this forum that 120 days+ is talked about .

    I have no trouble in creating a 120 day time template and viewing 1 minute data from 120 days ago. However, this is not a download.

    So, could you please tell me how far back Tick files (or smallest time interval) are available for download (with or without Quote data types)?

    And, assuming it is greater than 10 days, what do I need to do to get such data, and is it in the same format as Tick files downloaded fo Playback?

    Thank you.

  • #2
    greisha30246
    See this article in the eSignal KnowledgeBase on available historical data
    Alex

    Comment


    • #3
      120 Day Download

      Thanks Alexis for the info. I now see what is "available".

      The other part of the question was "What can I download?". Since 120 day/1 minute is the most granular I can get for older data, is there a simple method to download this data?

      By the way, when I request a download of "trades only" for (say) 4 days, I get many more days recorded on the resulting text file. For example, I requested 4 days of AB #F tick data on Sept 22. The resulting file contains dates going all the way back to Sept 02!!! I checked this with my YM downloads as well and had a similar experience.

      Seems that the downloader simply creates a file containing ALL data pertaining a symbol if there is a Tick chart currently running for that symbol, otherwise it requests it from the eSig servers. In my case, my current AB chart has data back to Sept 02 and my YM back to Sept 06 - consistent with the downloaded file headers.

      I certainly get the data I want, but when I simply want the last trading day to supplement existing downloads, I get a 16Mb file which does create some management and storage issues.

      Is this problem known/documented anywhere? Thanks.

      Comment


      • #4
        greisha30246
        With regards to your first question you can export data directly from a chart using the Data Export Tool (right click the chart, select Tools-> Data Export)
        That is probably the simplest solution for a one off download. If instead you need to download and maintain multiple data files for several symbols then you may want to look into a third party downloader such as QCollector
        As to the issue of downloading more than 4 days of tick data I don't seem to be able to replicate it. In the images below you can see the steps I just performed. In the last image you will see that the earliest date in the data file is 9/20/05
        Alex


        Comment


        • #5
          Downloader Anomaly

          Seems I may have uncovered a bug in Tick Downloader. Here are the Headers for some recent downloads I have run:

          ; Symbol=AB #F
          ; Date=09/02/05-09/22/05
          T,050902,000651,666.9,1,
          T,050902,000926,667.1,1,

          ; Symbol=YM #F
          ; Date=09/06/05-09/22/05
          T,050906,000252,10499,3,
          T,050906,000450,10498,7,

          ; Symbol=QM #F
          ; Date=09/13/05-09/23/05
          T,050913,000012,63.175,1,
          T,050913,000018,63.2,1,

          ; Symbol=NQ #F
          ; Date=09/23/05-09/23/05
          T,050923,000444,1575.5,1,
          T,050923,000444,1575.5,1,

          In the first two cases (AB & YM) I requested 4 days of Tick (trades only) data and for QM & NQ I only requested 1 day.

          NQ is the only one that loaded correctly and it is also the only one of the four that I don't currently have an Advanced Chart running for.

          In the first three cases, the start date of the downloaded data is the same as the first day that appears on the charts. All 3 charts are using Tick intervals. AB & YM are on 10 day time templates, whilst QM is "dynamic".

          Hope this demonstrates problem adequately. Happy to provide any additional info if I am able.

          ~~~~~~~~~~~~~~~~~

          Also, thank you for link to QCollector. At a quick glance it seems the same "restrictions" apply as for charts - 10 days of ticks and 120 days of minutes. So I'm not sure there is much advantage of the product from a data perspective. However, the download scheduling and management aspects do seem to offer some real benefit.

          ~~~~~~~~~~~~~~~~~

          I used the Data Export facility you suggested (don't know how I missed it!). Anyway, managed to get my 120 days of 1 minute data exported, though it is a bit of a pain to have to keep dragging the chart to get back to the earliest date available.

          Is this the only way to ensure that you get an export of the entire date range covered by the Time Template?

          Regards, G.

          Comment


          • #6
            greisha30246

            though it is a bit of a pain to have to keep dragging the chart to get back to the earliest date available

            You don't need to scroll backwards to get historical data. In the Time Template set up the required User Defined Interval to load 120 Days of data
            Alex

            Comment


            • #7
              120 Day Time Template

              Thanks Alexis.

              I had set "User Defined": Interval = I, # Days = 120 as only Time Template interval settings.

              After reading your reply I noticed that the header on the chart was reading "Dynamic". So I went back into Edit, Time Template.

              Next to "# Days " data entry field the annotation "0 is dynamic mode" is shown. This seems to be misleading because I had put 120 in there, yet chart behaved as Dynamic.

              Anyway, I then put in an additional Interval setting for "Intraday Default" of 120 days, and it all worked fine. (See attached)

              Regards. G.

              Comment


              • #8
                Attachment from previous posting...

                Problem with attachment on last posting. Hopefully this one will stick.

                Attachment is of Time Template that works for 120 day timeframe.
                Attached Files

                Comment


                • #9
                  greisha30246
                  If I zoom in the image you just posted (see attachment) it appears that the number 1 is actually the letter I which would explain why the chart was in Dynamic mode when set to a 1 minute interval. For that matter prior to your adding the Intraday Default any interval (other than T or V) would have been set to Dynamic with that Time Template since I is not a valid interval
                  Alex
                  Attached Files

                  Comment


                  • #10
                    Thanks for getting back to me so quickly.

                    Now, let's see if I've got this right.......

                    I checked the "I-Default" and "I" items and they were both "# Days" = 120 (not I20). I tried typing in "I20" in the "#Days" field and it saved as "Dynamic". This is not what I did previously since the values of 120 were saved as you can see.

                    I must admit I have gained my limited knowledge of Time Templates from looking at existing setups. However, I have never found any documentation giving a detailed list of the valid values for "Interval:", "# Days", etc. (though, I admit my searches may not be exhaustive).

                    So, I did some testing and found that I can put in values like 233T, 500V, I50 into "Interval:". In these cases the number portion gets dropped and the items appear as T, V and I respectively. If I have put in a "#Day" of > 10 for V and T these are replaced with 10 when I click "Update/Add".

                    "# Days" field is quite interesting. If I put in "12E" it gets saved as "12 Days" if I put in "E12" I get a result of "Dynamic".

                    In addition, I can "user define" an "Interval:" such as "5R". I'm not sure what use that could be, but Time Templates lets me do it.

                    In the template "Test2" (below) you can see that I have succeeded in saving interval "I" and 120 days. If I use this template it loads as "Dynamic".

                    In conclusion, an interval value of "I-Default" is valid yet, "I" is not. I'm sure many people have made exactly the same mistake as me and been baffled by the consequences.

                    I also feel that the field validation on Time Templates is very poor and should at least display a warning before data entered is changed when saved, and an error message when an invalid value is entered.

                    It would also be most useful if there were a "Help" button on the template panel for those of us trying to operate with limited knowledge.

                    Hope this goes some way to help others deal (correctly) with Time Templates.

                    Regards. G.
                    Attached Files

                    Comment


                    • #11
                      greisha30246

                      I checked the "I-Default" and "I" items and they were both "# Days" = 120 (not I20).

                      I was referring to the I in the Interval box. I is not an interval. The value in the Interval box must be either a number representing a specific interval ie 1, 5, 7, 60, etc or one of the following letters each corresponding to a specific interval that you can chart ie T (Tick-bar), V (Volume-bar), S (Seconds-bar), P (Price Change-bar), D (Daily), W (Weekly), M (Monthly). Since I is not a valid interval that is why up to the moment you added the Intraday Default all the charts were set to Dynamic by default.

                      However, I have never found any documentation giving a detailed list of the valid values for "Interval:", "# Days", etc. (though, I admit my searches may not be exhaustive).

                      See this article in the eSignal KnowledgeBase. FYI I found it by searching for Time Templates

                      "# Days" field is quite interesting. If I put in "12E" it gets saved as "12 Days" if I put in "E12" I get a result of "Dynamic".

                      That is because the Time Template is only concerned with a number in that field hence 12E equates to 12 whereas E12 is not a number hence it defaults to 0 (which is Dynamic)

                      In the template "Test2" (below) you can see that I have succeeded in saving interval "I" and 120 days. If I use this template it loads as "Dynamic".

                      This is for the reason explained earlier.
                      Alex

                      Comment


                      • #12
                        Time Template Documentation

                        Thanks, Alex.

                        I read the same documentation previously. No where in it does it refer to an interval "increment" (e.g. 1, 3, 5...) It only refers to interval "period type" (e.g. T, V, W....) as per copy of relevant piece of documentation (below).

                        Since it is not possible to put in intervals that would normally be associated with the EFS inv() statement (e.g. "233T", "500V") it seems to me to be a bit of guesswork to assume "1" might work, especially since "I" is accepted but does not work.

                        I feel that this is another area where documentation could be a little more complete, and clearer. Hopefully future releases will take care of that (Extra work of course. Sorry.) Regards. G.


                        The setting User Defined means that you want this template to be based on a specific interval that you setup in the Interval box. This includes D for Daily, W (weekly), M (monthly), as well as T (tick), S (seconds), V (volume), and P (price).

                        Comment


                        • #13
                          greisha30246
                          Actually with the exception of tick-based charts (ie T, V, P and S) one can use the intervals normally associated with the EFS2 inv() function. The reason why specific tick based intervals cannot be defined at this time is because they are downloaded in whole day segments only so you would not be able to download for example 300 bars of 133T. However eSignal has indicated that in the future tick based intervals will be downloadable in size segments.
                          As to the excerpt of the documentation you posted I guess it is a matter of interpretation. To an end user like myself it clearly means that you can define any specific interval you want including the letters D, W, M etc.
                          Alex

                          Comment

                          Working...
                          X