 Tweet
Tweet
I am a Esignal Basic subscriber..I am looking for the day session only, continuous for the YM & AB .... comparable to the ES #F=2 and NQ #F=2 ....Thx
-
-
kralcd
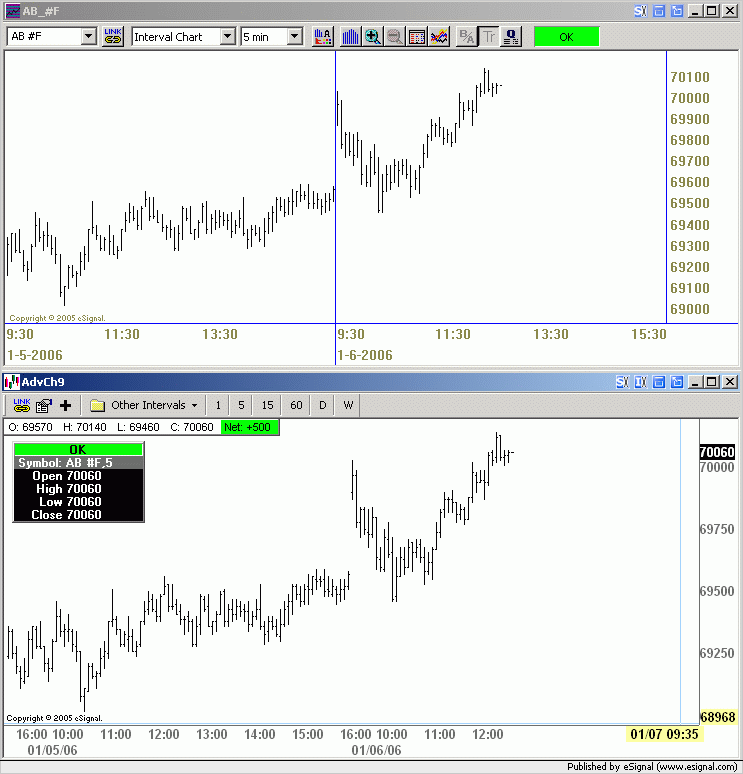
In the Standard Chart click the Properties icon then select the General tab. In the dialog box set the Open and Close Time(s) to 9:30 and 16:15 respectively. The result will be as shown in the following image that compares the Standard Chart to the Advanced Chart also set to show only 9:30 to 16:15
Alex
-
Alexis - you might be able to answer this.
When I look at the YM or AB charts (say "YM #F" or "AB #F") on a Daily timeframe then I notice that the opening price for the day is never correct on either symbol until the day ends and we receive the first tick from the following day.
Have you seen this before and know how to resolve this?Standing on the shoulders of giants.Comment
-
wildfiction
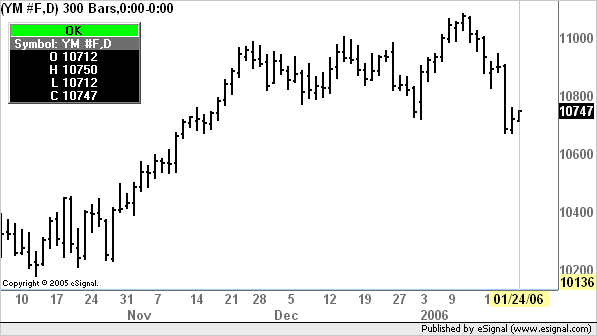
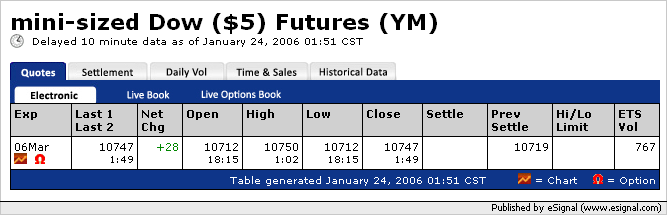
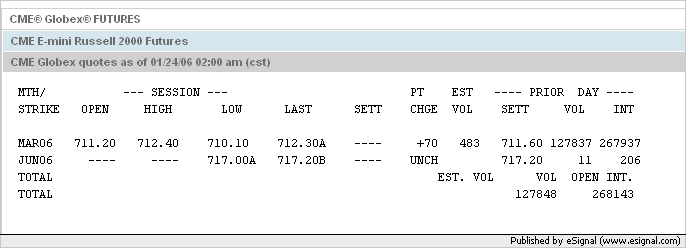
Which type of chart are you referring to? If Advanced Charts I don't recall having seen this problem. For example if I look at the daily chart of YM or AB at this time the Open for either one matches the values shown by the respective exchanges (see images below)
Alex
Comment
-
Thanks Alexis - let's check again tomorrow morning and see if the Daily YM opening value for 24 Jan is same as you have recorded here.Standing on the shoulders of giants.Comment
-
Hi Alexis,
It's 9:36 PM EST and I'm just looking at the opening price for YM for today (24 Jan 2006) and it is showing 10739 - please see attached chart.Attached FilesStanding on the shoulders of giants.Comment
-
-
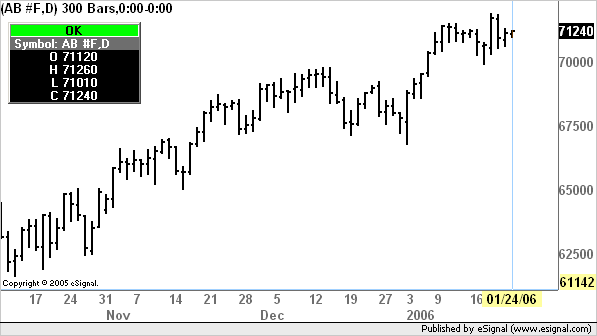
The attached chart shows the AB at 11:45 PM EST - one of the charts is a 60min bar chart and the other is a Daily chart. I think that the opening price is wrong on the daily chart - that price wasn't hit until way later in the day... I believe.Attached FilesStanding on the shoulders of giants.Comment
-
-
wildfiction
I understand now what you are referring to. This happens with symbols that have overnight trading and only in between the opening of the new session - ie the session of the next trade date - and midnight. During that period eSignal combines the new session with the current daily bar so the Open and Close you are seeing are those of the new session. At midnight a new daily bar is created for the new trade date and the prior day's bar is restored to its original values.
As far as I know this is supposed to change in the next version of the software (eSignal has not provided a release date at this time).
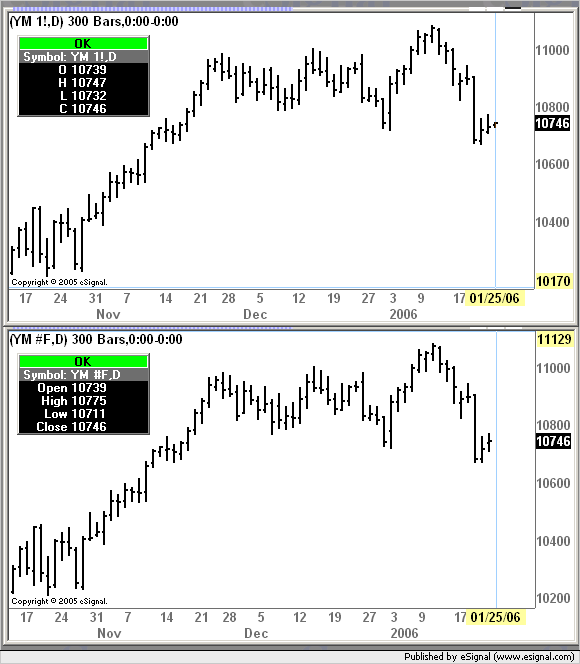
Interestingly though the 1! continuous futures do not appear to have this problem. In the following image notice in fact that while the on the #F chart the sessions of the 24th and 25th are still combined the 1! contract is already showing the session of the 25th as a separate bar.
Alex
Comment
-
wildfiction
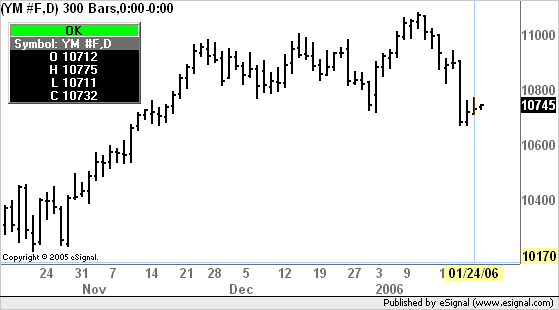
As explained in the prior message at midnight the prior bar is restored to its original values. Notice in fact in the enclosed image that a new bar has now formed for the 25th and the bar of the 24th has the same Open of 10712 shown in the image I posted earlier in the day
Alex
Comment
-
Right - I see the restored price. What I find confusing is the fact that a historic price (i.e. the opening price) changes depending on when you look at it - but you say that will be resolved in the future?
When I look at YM #F and YM 1! the appear identical - my computer is set to EST - not sure about yours?
What about the AB chart? Any idea why the opening price is shown to be way higher than it should be?Standing on the shoulders of giants.Comment
-
wildfiction
During the period in which the two sessions are combined the Open should be that of the new trade date session. If you look at the pre-midnight chart of YM I posted earlier in this thread you should see that the Open is showing 10739 which is in fact the Open of the 25th.
If the 1! contracts are set up with the same specifications as the #F then they should match.
My computer is also set to Eastern Standard Time.
With regards to AB I am seeing an Open of 720.00 at this time and I believe it was the same value even before midnight. However someone else posted a message about a problem with this symbol (see this thread)
AlexComment
-
Thanks Alexis!Standing on the shoulders of giants.Comment
Comment