 Tweet
Tweet
On my charts for Gas and OIL (QG, QM), I am getting bar highs and lows that can not correspond to any actual tick values that one can enter on or trade from. This is effecting the math of routines since I base an entry on a tick value above a certain calculated line, but that value can never exist in real trading.
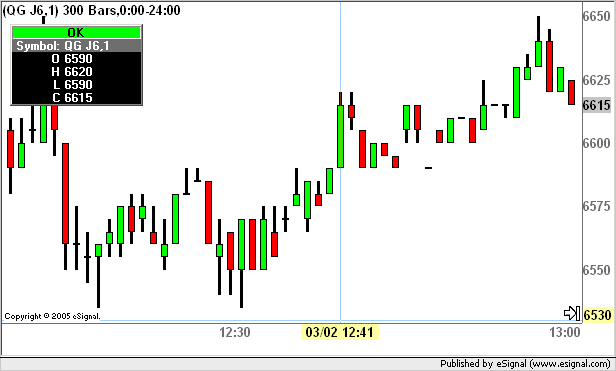
For instance, take a look at today's (Mar 2) QG J6 chart. The high at 11:41 (CT) was 6620-fine. But the low and open was 6589, which is no real tick value on the live market -- it should be 6590.
In other words the bars are showing values that simply do not exist is real life. They are close, very close, but why monkey around -- let's get exact.
I have a signal that generates an entry 2 tick (Tick = 0.005) values above 6589, and since that value, 6599, never exists, I never generate a signal. This does not happen all the time, but there are bars that have HLOC that are not true market tick values. See pic
Attached Files
Comment