I have noticed recently that the $TVOLQ chat has become a mess, I wonder is eSignal aware of this and are they planning to do something. plz see attached chart.
Thanx for the reply, odd that it seems to be a new problem, it is not like $TVOLQ is at unusually high levels, avge vols are if anything quite low so it was quite capable of passing this "threshold" before. Anyway glad to hear someone is doing something about it
I see this mess has now spread to the NYSE quotes $tvol, add that to the problems with $voldq the other day and this platform is starting to fall apart.
I asked via Chat early this year for this to be fixed - nothing. So I tried emailing instead. I have an email from Avery last May saying this is "on the active fix list". But still it is not fixed.
Has eSignal completely abandoned US equity traders?
Hi Shaeffer,
The problem you’re seeing on the charts where the Tick Volume exceeds the threshold our Tick Server can hold is something we have been diligently worked on. We’ve tested some newer versions of the Tick Server, which we have varied in success and we’ve had few set backs. But with some internal tweaking the latest version looks very promising and is holding up excellent to all tests. We’re rolling these new Tick Servers out as quickly as we can and should have them all completed and available to you in the coming month or so.
How is it going with the problem of $TVOLQ > 2^32.
This flows over to other software also, that use eSignal for data. I use MultiCharts (no fix, they say their software works correctly and it is data vendor's problem).
It just seems like every time the Volume > 2^32 (4.29 Billion) intraday the data freaks out and goes to some weird negative number. It seems like a premier company like eSignal would have had a fix for this years ago when the volume first started getting this high. Since I switched over from TS2000i, it is really bugging me.
The only thing I can do is go to 64 bit software...?
A few month ago and then just recently I spent time in a trading room where the head traders both use eSignal. Both have complained and cursed eSignal's inability to get the $TVOLDQ chart fixed. This in turn caused TradeStation users in the room to comment that that is one example of why they left eSignal. There are many newbies in these rooms asking which charting software to use. My point is that its been almost a year since I first asked for a fix for this, so not only are existing eSignal users frustrated by eSignal program glitches or server problems (or whatever the reason), but daily there are potential new eSignal customers that never will be.
Yes, it seems very odd indeed. Years ago Tradestation seemed to have "fixed" it in their Globalserver so it would look correct in TS2000i. It would seem that eSignal software guys could use a similar fix.
I use this symbol everyday in some complicated indicators that show me whether volume is higher than normal or lower than normal on an intraday basis in real time looking back over the past 20 days. Luckily I mostly use it earlier in the day prior to it going nuts.
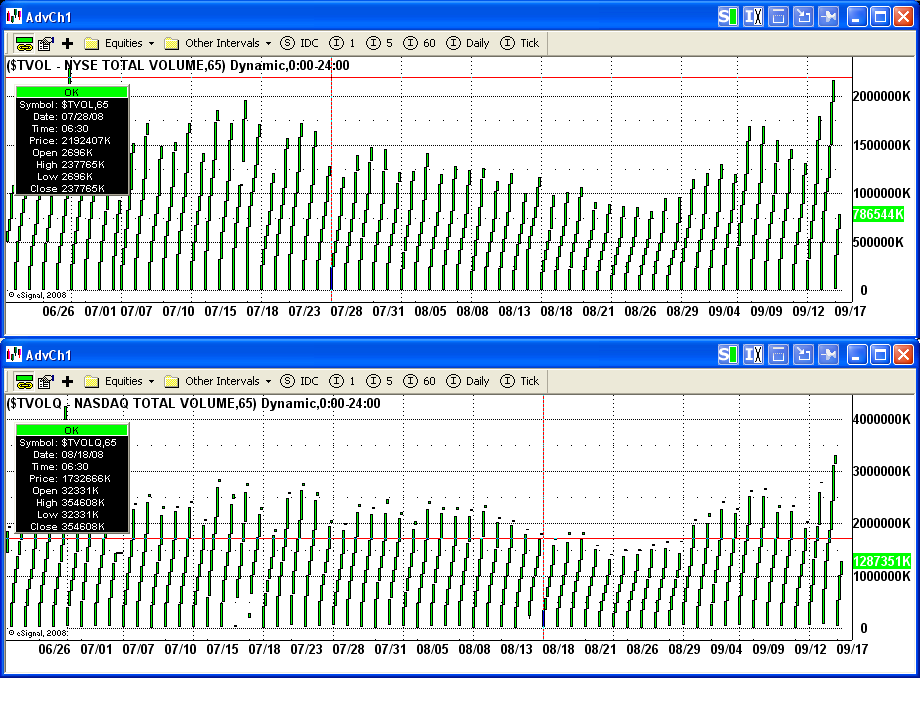
We know this was a long time coming but there should not be any issue with the Total Volume on charts any longer. Our farm's Tick Servers under went a major overhaul to resolve several issue that have manifested themselves with the increase volume and volitility of the markets. As of August no user should see the Volume buffer overload issue.
If you're continuing to see issue on the charts please let us know.
Attached are two charts of the $TVOL and $TVOLQ. Yesterday we saw record volume on both the NASDAQ and NYSE and as you can see there was no issue with the Volume Charts.
I'm currently connected to the same server that RobotMan is connected to and these screenshots are of that data.
 Tweet
Tweet

Comment