Announcement

Collapse
No announcement yet.

Daily chart of US stocks/futures

Collapse
X
 
  • Filter
  • Time
  • Show
Clear All
new posts

  • Daily chart of US stocks/futures

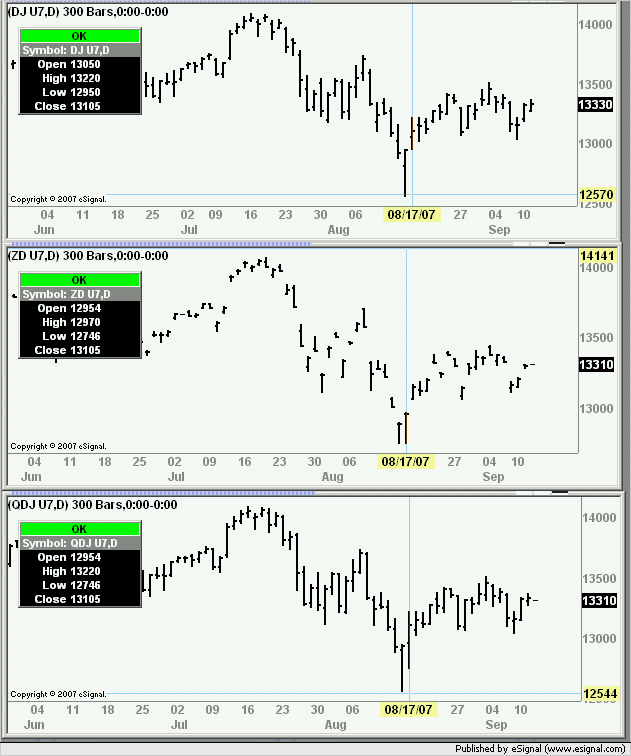
    When I look at the daily chart of a US stock or future just after the market has closed, often I find the day's bar and volume doesn't match with the intra-day charts.

    Is there a specific cut-off time when eSignal updates the daily bar?

  • #2
    Here is an example: first the daily chart. Note the OHLC (see the cursor window, the cursor is on today's bar). Also note the volume.

    Time now is 18:34 ET.
    Attached Files

    Comment


    • #3
      And here is the 15 minute chart of today's YM. I have marked the high and the low. The high is the same as the the daily chart high, but the low and the close are different. Also, note how the volumes are dramatically different. The daily chart shows a high volume day. Not so, according to the 15 minute chart.
      Attached Files

      Comment


      • #4
        bf2
        The daily bars of all futures always include all the trading sessions for the trade date and the Settlement.
        In the specific case of the mini-sized DOW there is only one trading session which starts at 18:15 CT and ends at 16:00 CT of the following day which is the trade date (you can view the contract specs here).
        So the Open of the daily bar corresponds to the price traded at 18:15 CT of the day prior to the trade date, the High and Low values include all of the trading within the session that starts at 18:15 CT of the day prior to the trade date and ends at 16:00 CT of the trade date and the Close includes the Settlement which is usually posted within minutes of the end of trading.
        Having said that eSignal provides for some futures a "synthetic" symbol which uses the pit session times of the equivalent full size contract. To plot this symbol add an =2 extension to the original symbol eg YM U7=2 or YM #F=2. In this case the daily and intraday data will cover only the pit session which for the full size contract is from 7:20 CT to 15:15 CT (and not 8:30-15:15 like you have in your Time Template for the 15 minute chart). FYI you can find the contract specs for the DJ contract here.
        You may also want to read a similar reply I posted in this thread with regards to the CME e-mini equity index futures.
        Alex

        Comment


        • #5
          Hello Alexis,

          Thank you for the explanation that is very useful to understand how eSignal futures charts work.
          I have one question about the DJIA Futures ($10 Multiplier). In the specifications page there are two symbols for this contract one for Open Auction and the other for Electronic. Does the daily bar include both sessions for this contract?
          Thank you in advance for your responce
          Raffaele

          Comment


          • #6
            Raffaele
            You are most welcome and thank you for letting me know that you found my explanation useful.
            To answer your question in the case of those contracts that have different symbols for the regular and electronic sessions the daily bar will plot only the data for the session specific to that symbol.
            So for the symbol DJ the daily bar includes the trades between 7:20 CT and 15:15 CT while the daily bar for ZD includes the trades between 18:15 CT and 7:00 CT. As far as I know the Settlement is used as the Close in both symbols
            For these cases eSignal also provides a 'composite future' symbol which combines on the same daily bar the data from the two sessions. The root symbol for the $10 Dow Jones contract is QDJ (front month would now be QDJ Z7 and the continuous QDJ #F)
            In the screenshot enclosed below you can see three charts plotting DJ, ZD and QDJ respectively. As you can see in the composite future chart the Open is the that of the elctronic session, the High and Low are the highest High and lowest Low recorded on either symbol and the Close is the Settlement.
            You can find a list of the available composite futures in a Quote Window called Composite Futures.quo which is installed in the eSignal folder.
            Hope this helps
            Alex

            Comment


            • #7
              Alex, thanks for the reply.

              Does the same apply for NASDAQ and NYSE stocks? When does the daily chart get updated for them?

              REgards.

              Comment


              • #8
                bf2
                The daily bars of stocks include only the regular trading hours (ie from 9:30 ET to 16:00 ET) and the Settlement
                Alex

                Comment

                Working...
                X