Announcement

Collapse
No announcement yet.

incorrect daily OHLC data for many futures symbols

Collapse
X
 
  • Filter
  • Time
  • Show
Clear All
new posts

  • incorrect daily OHLC data for many futures symbols

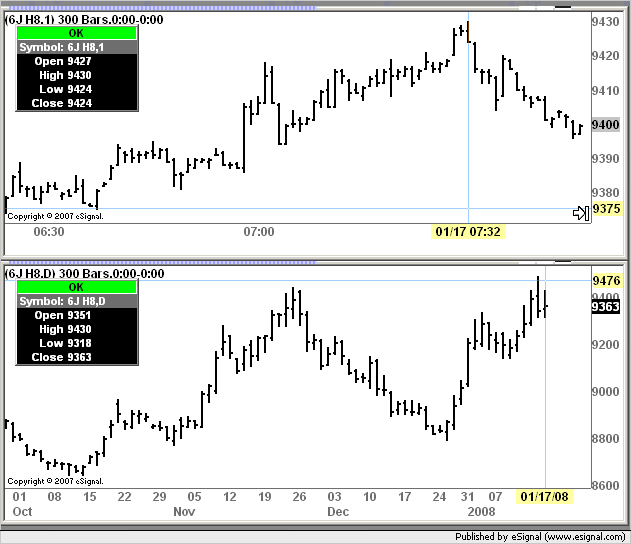
    I just find that for many futures symbols, the last daily candlestick bar is not built correctly. For example, on 6J H8 daily chart, the high of the today is 0.9379, while the actual high should be 0.9352 (reached at 07:32 EST today.

    The trading hour of 6J is 06:00pm - 05:00pm EST and the regular trading hour is 09:30am0„2-0„204:15pm0„2EST.

    Does eSignal v10r4 only bruilds daily bars of these futures according to trades executed within regular trading hours?

    A related but different problem is reported in this thread.


    This is a critical issue and please explain what is exactly the reason. Is this a eSignal v10r4 bug or some misconfiguration problem?

    - Clearpicks
    Attached Files

  • #2
    Re: incorrect daily OHLC data for many futures symbols

    clearpicks
    FWIW I am showing 9430 as the High of today for 6J H8 in both the daily and intraday charts
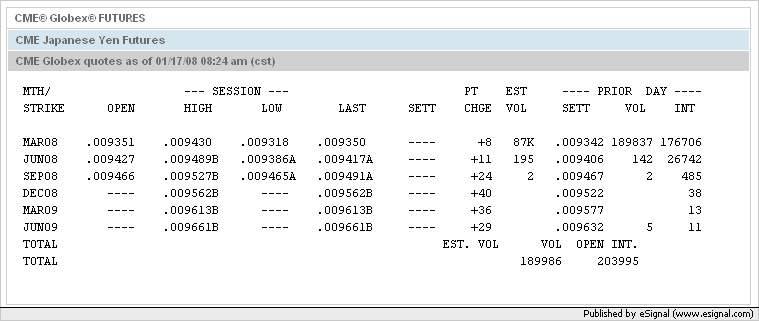
    Based on the CME's site this appears to be the correct value
    Alex


    Originally posted by clearpicks
    I just find that for many futures symbols, the last daily candlestick bar is not built correctly. For example, on 6J H8 daily chart, the high of the today is 0.9379, while the actual high should be 0.9352 (reached at 07:32 EST today.

    The trading hour of 6J is 06:00pm - 05:00pm EST and the regular trading hour is 09:30am0„2-0„204:15pm0„2EST.

    Does eSignal v10r4 only bruilds daily bars of these futures according to trades executed within regular trading hours?

    A related but different problem is reported in this thread.


    This is a critical issue and please explain what is exactly the reason. Is this a eSignal v10r4 bug or some misconfiguration problem?

    - Clearpicks
    Comment


    • #3
      Re: incorrect daily OHLC data for many futures symbols

      I wrote the incorrect number in my previous post. The actual high reached at 07:32 EST should be 0.9430, which is exactly the daily high of today (as CME quote).

      The reason you got the correct chart is because you opened the chart later than me (your reply was posted after 9:30 EST while my eSignal was started way before 9:30 EST). I think there might be something wrong on eSignal server side so that it messed up how the daily OHLC should be reconctructed from both historical data and realtime data stream. I think for the current trading day, it might first retrieve data from higtorical data server then add whatever realtime data to the current bar and update the HLC of the currect bar. If there is anything wrong in the algorithm or the delimit time configuration, it would result in the problem I just reported in this 6J thread and the YM thread.
      As I said in my YM thread, there is no problem if I open eSignal during regular trading hour, i.e. after 9:30 EST.

      Try to open a daily futures chart in evening or in early morning, you would see the problem. ( It is most easy to identify the incorrectness if you choose a symbol which has big overnight or early hour runup or crash.


      Originally posted by clearpicks
      I just find that for many futures symbols, the last daily candlestick bar is not built correctly. For example, on 6J H8 daily chart, the high of the today is 0.9379, while the actual high should be 0.9352 (reached at 07:32 EST today.

      The trading hour of 6J is 06:00pm - 05:00pm EST and the regular trading hour is 09:30am0„2-0„204:15pm0„2EST.

      Does eSignal v10r4 only bruilds daily bars of these futures according to trades executed within regular trading hours?

      A related but different problem is reported in this thread.


      This is a critical issue and please explain what is exactly the reason. Is this a eSignal v10r4 bug or some misconfiguration problem?

      - Clearpicks
      Last edited by clearpicks; 01-17-2008, 08:27 AM.

      Comment


      • #4
        Alex told me that his eSignal was kept running through the whole night. I opened eSignal arround 8:45~8:50am EST which is after the early morning peak at 7:20am. Therefore it seems the reason that Alex's chart is correct is because 0.9430 was added to his daily bar by realtime streaming data. I just further looked at my screenshot, the 0.9379 was exactly the high of 5min bar at 8:45 and it is also the highest price between the time I started eSignal and the time I made the screenshot. It supports my suspection that there is something seriously wrong in eSignal regarding how the daily bar is rebuilt from both historical data and streaming data outside of the regular trading hours. ( In 6J case, it is 09:30am - 04:15pm EST). So as long as I started eSignal before 9:30am in the morning, it does not retrieve those trades between 6:00pm EST yesterday and current time ( in my case this morning 8:45am ).

        - Clearpicks

        Comment

        Working...
        X